Strategy
Not every metric is a KPI. Learn which social media KPIs to track, how to set SMART targets, and how to report results that show impact.
- Also available in
- Español
- Deutsch
- Français
Key takeaways
- Social media KPIs are the specific metrics tied to your business goals, not just any number you can track.
- The most important KPIs fall into six categories: engagement, awareness, conversions, ROI, customer care, and content performance.
- Setting effective KPIs starts with your business objectives and uses the SMART framework to create measurable targets.
- Tracking KPIs across platforms is faster with a unified analytics tool that consolidates reporting, benchmarking, and cross-channel comparison in one view.
Social media KPIs (key performance indicators) are numbers that help you measure how well your social media strategy is working.
Unlike general metrics like impressions or likes, social media key performance indicators are tied to specific business goals.
For example: if your goal is to grow brand awareness, your KPIs might include follower growth rate and post reach. If you’re focused on customer care, you might track average response time or resolution rate.
The key word here is key. A KPI isn’t just any number you can measure. It’s the number that tells you whether your work is moving the needle in the right direction.
KPIs help answer questions like:
- Is our content strategy working?
- Are we reaching the right people?
- Are we getting results that help the business?
Bonus!!!
Get a free social media report template to easily track and measure performance against your KPIs.
Social media KPIs vs. metrics: What’s the difference?
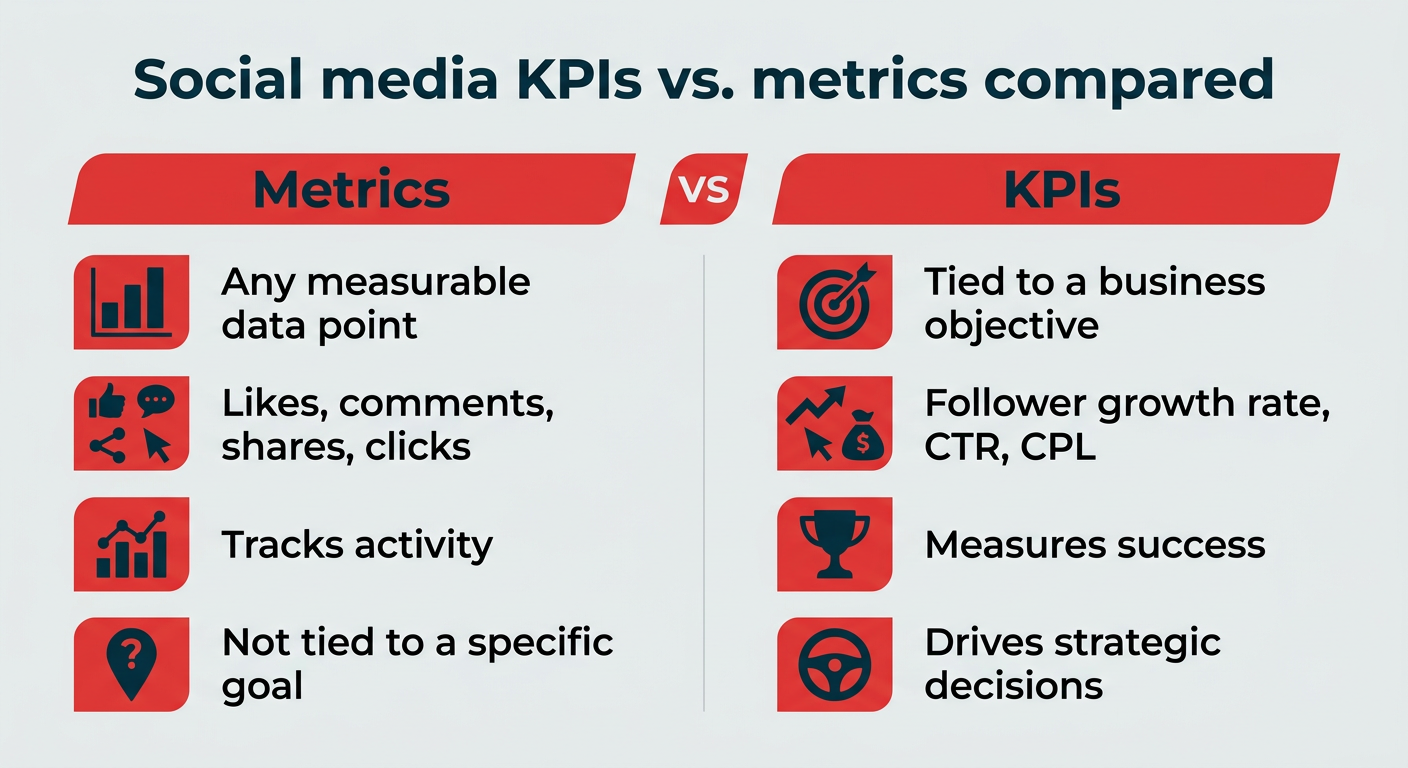
People often use KPIs and metrics interchangeably, but they serve different purposes.
- Metrics: Any measurable data points you track, such as likes, comments, shares, and clicks.
- KPIs: The key metrics that are directly tied to a specific business goal. They’re the numbers you actually use to measure success.
Think of it this way: all KPIs are metrics, but not all metrics are KPIs.
Let’s say your goal is to grow your audience. You might track a range of metrics: impressions, engagement rate, shares. But your KPI might be weekly follower growth. That’s the one tied to your outcome.
Here’s a quick breakdown:
Feature
Metric
KPI
Definition
Any measurable data point from your social accounts
The metric that measures progress toward a business goal
Example
Total likes on a post
Weekly follower growth rate
Tied to a business goal?
Not necessarily
Yes, always
Used to measure success?
No, it’s context
Yes, it’s the scorecard
Who uses it
Social team, day to day
Social team and leadership
Why do social media KPIs matter for brands and teams?
Tracking social media KPIs keeps your team focused on what matters and proves your work is making an impact. Here’s why KPIs for social media are essential:
- KPIs keep your team aligned. They give everyone, from creators to execs, a shared understanding of what success looks like. Whether it’s reach, clicks, or conversions, your whole team works toward the same goals.
- Measure progress against business objectives. KPIs connect your daily posts to bigger outcomes, like sales, leads, or brand awareness.
- Justify budget and headcount. Need more resources? With 59% of CMOs reporting they had insufficient budget to execute their strategy in 2025, solid KPIs help make your case. If you can show how your work contributes to growth, it’s easier to unlock or justify budget to hire more help.
- Spot what’s working, and fix what’s not. KPIs highlight the tactics that deliver real results. You can double down on high-performing content and adjust quickly when something underperforms.
- Make reporting easier. KPIs give structure to your social media reports, so you can show clients, stakeholders, or leadership exactly how your content is performing and why it matters.
- Support governance across teams and regions. For enterprise organizations managing multiple brands, regions, or teams, KPIs create a shared measurement framework. They help ensure every team is contributing to the same strategic priorities, even when tactics differ by market or platform.
The most important social media KPIs to track in 2026 fall into six categories: engagement, awareness, conversions, ROI, customer care, and content performance.
We’ve broken the building blocks down below:
- Engagement KPIs
- Awareness KPIs
- Conversion KPIs
- ROI KPIs
- Customer care KPIs
- Content performance KPIs
Remember, your social media KPIs will incorporate SMART components like targets and timeframes. Think of the KPIs below as the foundation, and those SMART components as the building elements that make your KPIs unique to your business and your strategic goals.
Engagement KPIs
Engagement KPIs measure the quality of the interactions with your social followers. They show you whether your target audience is connecting with what you have to say and is willing to interact with your brand.
KPIs for social media engagement include:
- Likes: The number of times followers interact with a social post by tapping the like button within a given social media platform.
- Comments: The number of times people comment on your posts. A comment requires more effort than a simple like and generally represents a higher level of engagement. Comments can have a positive or negative tone, though, so a high number isn’t always a good thing. For this to be a meaningful engagement KPI, social media managers also need to track social sentiment.
- Clicks: How many times users click the link in your post. This helps track how people engage with content beyond the social platform. Using the Ow.ly URL shortener allows you to track clicks in Perch by Hootsuite without setting up any additional tracking.
- Shares: How many times your post has been shared from one user to another. The number of shares alone doesn’t tell you if people like what they see, but it’s a good indication of whether people are passionate enough to spread the word.
- Saves: Saves (or bookmarks) generally indicate that people find your content useful enough to return to later. That’s a sign you’ve provided something educational, entertaining, or otherwise valuable.
- Average engagement rate: This metric divides all the engagement a post receives, including likes, comments, saves and shares, by the total number of followers on your social account. It shows how engaging, on average, your content was. If you don’t want to do the math yourself, try our free engagement rate calculator.
- Amplification rate: A measure of how much your followers extend your reach by sharing your content with their own followers. A high amplification rate shows that your followers want to be associated with your brand or find your content valuable enough to pass along.
- Social share of voice: This metric tracks how many people mentioned your brand, compared to the number of people mentioning your competitors. It shows how relevant your brand is within your industry. To calculate it, divide your brand mentions by the total number of industry mentions. A social listening tool like Lumen can measure your own and your competitors’ mentions during a specific timeframe.
Here’s how to calculate amplification rate:
Awareness KPIs
Awareness KPIs measure how many people are seeing your content and becoming familiar with your brand. With social networking sites estimated to reach 5.75 billion users in 2026, these KPIs are especially useful if you’re trying to grow your audience, launch a new product, or build name recognition in a competitive space.
- Impressions: The number of times your post was visible in someone’s feed or timeline. It doesn’t mean the person noticed or engaged with it, just that it appeared on their screen. Tracking impressions alongside engagement rate helps you see whether visibility is translating into action.
- Follower count: The number of followers your social channel has at a set point in time. On its own, follower count is a snapshot, not a trend. It becomes more meaningful when tracked alongside audience growth rate.
- Audience growth rate: This shows how your follower count is changing over time, so you know whether you’re gaining followers or losing them. To track it, divide your net new followers by your total follower count.
- Reach: How many people see a post. Reach changes based on factors like when your audience is online and how good your content is. It gives you an idea of what your audience finds valuable and interesting.
Conversion KPIs
Conversion KPIs on social media reveal whether your social strategy is leading to real-world outcomes beyond the social sphere, especially as social commerce accelerates, with 51% of US social buyers expected to shop on TikTok this year.
- Click-through rate (CTR): The percentage of people who viewed your post and clicked on the CTA (call to action) it included. This shows whether your content captures your audience’s attention and inspires them to act.
- Conversion rate: The number of users who perform the action in your social media CTA (visit your website or landing page, subscribe to a mailing list, make a purchase) compared to the total number of clicks on a given post. A high conversion rate indicates your content is contributing to your sales funnel or otherwise supporting business growth.
- Bounce rate: Not everyone who clicks on your social links will follow through. Bounce rate is the percentage of visitors who clicked a link in your post, then quickly left that page without taking any action. You want this to be low, since a high rate signals the experience didn’t match expectations.
- Cost per click (CPC): The amount you pay for each individual click on your social media ad. Track this to see if the amount you’re spending is a worthwhile investment.
- Cost per thousand impressions (CPM): The amount you pay every time 1,000 people are served your ad. Since this is about awareness rather than conversion, you want the cost to stay relatively low. Make sure you understand your sales funnel so you can tie the value of exposure to real business growth.
Here’s how to calculate click-through rate and conversion rate:
ROI KPIs
ROI KPIs help you connect social media performance directly to revenue. With advertisers set to spend over $121 billion on U.S. social networks in 2026, tracking these KPIs is essential.
These are the numbers that matter most when you’re making the case for budget, headcount, or strategic investment in social.
- Earned media value (EMV): Estimates the dollar value of organic exposure your brand receives through mentions, shares, and other unpaid interactions. EMV is typically calculated by assigning a cost-per-impression or cost-per-engagement value based on what equivalent paid media would cost, which helps quantify word-of-mouth in financial terms your leadership team can understand.
- Cost per lead (CPL): Measures how much you spend on social media to generate a single qualified lead, including ad spend, content production costs, and any tool or platform fees tied to the campaign. Tracking CPL helps you compare the efficiency of social against other marketing channels.
- Cost per acquisition (CPA): Goes a step further than CPL by measuring the total cost to acquire a paying customer through social media, accounting for the full journey from first touch to conversion. A lower CPA means your social strategy is efficiently turning audience attention into revenue.
- Leads generated from social: The total number of leads (form fills, demo requests, newsletter signups) that can be attributed to your social media efforts. It’s one of the clearest ways to show that social is contributing to pipeline. Use UTM parameters and platform tracking to attribute leads accurately. Tools like Perch by Hootsuite can help connect social activity to lead generation data.
Customer care KPIs
These KPIs track how social media users feel about their experiences with your brand. Customer service KPIs help you measure satisfaction, response efficiency, and long-term customer value.
- Customer satisfaction score (CSAT): Shows how happy your customers are with their experience following an interaction with your social customer service team. A tool like Nest by Hootsuite can help teams manage customer care workflows, track CSAT, and connect customer conversation data to reporting in Perch.
- Net promoter score (NPS): Measures your followers’ brand loyalty. After someone makes a purchase or has an interaction with your customer service team, ask them one question: How likely would you be to recommend this product to a friend? Give respondents the chance to answer using a numerical scale, usually of 0 to 10.
- Customer lifetime value (CLV): The total amount of money a customer will spend on your product or service over their entire lifetime as a customer. Understanding your CLV gives you a sense of how much you can afford to invest on individual customer acquisition. Calculate it as: Average purchase value x Average purchase frequency x Average customer lifespan.
- Average response time: A measure of how long it takes for a customer service agent to respond to a customer after their first contact. You want this number as low as possible, and a social media chatbot can help by resolving many basic queries without agent intervention. Calculate it by dividing the total time spent on initial customer queries by the total number of queries addressed, or track response time automatically in Nest.
- First contact resolution rate: Measures how often customers get a resolution from the first agent they speak to. If you’re using an automated assignment tool, this measures how well the tool understands customer requests and which team members can answer them. Customers get increasingly frustrated each time they’re passed along, so a higher first contact rate generally leads to higher satisfaction. Calculate it by dividing the number of cases resolved by the first agent by the total number of resolved cases.
- Issue volume: Tracks the number of customer issues, complaints, or questions you receive over a given period. It helps you identify support trends, measure team workload, and spot potential issues with your product or messaging. A sudden spike might indicate a marketing campaign gone wrong or a system-wide issue that needs urgent attention.
Here’s how to calculate net promoter score:
Content performance KPIs
Content performance KPIs tell you how well your posts are landing with your audience. With global daily social media usage down to 141 minutes per day, they help you figure out what types of content are working, what’s falling flat, and what you should make more (or less) of.
- Views (for video content): How many times your video was watched. Most platforms count a view once someone has watched a few seconds, but the definition varies by network. Views are especially helpful when comparing performance across video formats like Reels, Stories, and TikToks.
- Average watch time and completion rate: Tells you how long people are sticking with your video content, and whether they’re watching all the way to the end. If average watch time drops off early, you might need to tighten your hook or front-load your most important info.
- Content hit rate: The percentage of your posts that beat your average engagement rate over a given period. A rising hit rate means more of your content is landing, not just your occasional breakout post. Review your top posts on each platform at the same time and look for patterns in format, theme, and creative. In , you can filter and view your top content by engagement, impressions, clicks, and more, so you can double down on what’s working.
- Content frequency: How often you’re posting, and whether that pace is helping or hurting your results. There’s no one-size-fits-all answer, but tracking frequency alongside your engagement KPIs helps you find the sweet spot. Too little, and you risk disappearing from feeds. Too much, and you might see a drop in quality or follower fatigue. Use this data to shape your content calendar.
The right KPIs depend on what you’re trying to achieve. Use the table below to match your primary business goal to the social media KPI examples that actually measure progress against it.
Business goal
Recommended KPIs
What they tell you
Brand awareness
Reach, impressions, social share of voice, amplification rate
How many people are seeing your brand, and how often they pass it along
Lead generation
Click-through rate, conversion rate, cost per lead, leads generated from social
Whether social traffic is turning into pipeline, and at what cost
Community growth
Audience growth rate, average engagement rate, saves, comments
Whether your audience is growing and staying involved
Revenue and ROI
Cost per acquisition, earned media value, conversion rate, CPC and CPM
How efficiently social spend converts into customers and revenue
Customer retention
Customer lifetime value, net promoter score, sentiment, issue volume
Whether existing customers stay loyal and keep spending
Customer care
Average response time, first contact resolution rate, CSAT
How quickly and effectively your team resolves customer issues
Setting social media KPIs is a three-step process. Work through it in order, because each step informs the next:
- Start with your business objectives
- Research competitors and industry benchmarks
- Apply the SMART framework
Start with your business objectives
Your social media KPIs should always be tied to an overall strategic goal. With 46% of CMOs asking how to prioritize the marketing initiatives most likely to drive growth in 2026, defining your end game has never been more important.
For example, is the goal of your social media campaigns to increase brand awareness? Drive website traffic? Or to get more conversions and sales?
Once you decide on a strategic direction, it’s time to break that down into individual goals and associated KPIs for social media.
Take, for example, if your end game is to drive website traffic, then one of your KPIs might be tied to the number of clicks from social media to your site. To maximize your effectiveness, consider strategies like zero-click content that can keep users engaged without leaving the platform.
Research competitors and industry benchmarks
Next, figure out what success looks like for social accounts similar to yours.
With Perch’s social media benchmarking tool, you can find out how others in your industry are doing on social and compare your results for social media metrics like:
- Profile impressions
- Profile visits
- Followers
- Audience growth rate
- Engagement rate
- Video plays
- Posting frequency
- Clicks
- Shares
You can also get even more granular and compare your performance to specific competitors rather than your industry as a whole.
If measuring social performance is new to your team, make sure you collect your own benchmark data too, so you know where you’re starting from.
Meet the Suite
Understand what matters, decide what to do next, and take action across every social workflow — all from one connected suite.
Apply the SMART framework
Comparing your current performance to that of your industry helps you set more realistic KPI targets. Like your overall business goals, your social media KPIs should be SMART:
- Specific: Include a clear target. For example, do you aim to increase the brand’s Instagram follower count by 500 next month? Do you want to increase your click-through rates by 20% by the end of the year?
- Measurable: KPIs incorporate metrics to track and quantify your progress. You should always be able to determine how close you are to meeting the goal.
- Attainable: Keep it real. Set KPIs that are within an achievable scope based on the overall industry and your own resources.
- Relevant: Make sure each social media KPI connects to the business’s larger goals.
- Timely: What’s the timeframe for achieving this goal and determining whether success has been met? One month, six months, one year?
How to track and report on social media KPIs
Tracking social media KPIs comes down to three decisions: how you’ll collect the data, how often you’ll review it, and how you’ll present it to the people who fund your work. Get those three right and reporting stops being a monthly scramble.
Choose a tracking method
You have two realistic options: native platform analytics or a unified social media KPI dashboard.
Native analytics are free and reasonably detailed, but each platform defines metrics differently and none of them talk to each other. That means manual exports, spreadsheet math, and no single view of performance. A connected system pulls every account into one place so cross-platform reporting takes minutes instead of days.
Whichever route you take, look for these capabilities:
- Cross-platform reporting: One view of every account, with consistent metric definitions
- Industry and competitor benchmarking: Context for whether your numbers are actually good
- Custom date ranges: So you can report on campaigns, not just calendar months
- Exportable reports: Scheduled PDF or CSV exports for stakeholders who don’t log in
- Team collaboration and permissions: Shared access with governance across regions or brands
- Customer care data: Response time and resolution metrics alongside content performance
Set a review cadence
KPIs only drive decisions if someone looks at them on a schedule. Pick a cadence and protect the time.
- Weekly: Tactical checks on live campaigns and recent posts, so you can adjust creative or spend quickly
- Monthly: Strategic review of progress against targets, plus reporting to stakeholders
- Quarterly: Reassess the KPIs themselves. As social trends evolve, your KPIs should shift with them
Present KPIs to leadership
Executives care about outcomes, not post-level detail. Lead with the KPIs tied to revenue, pipeline, and cost efficiency, then keep the supporting metrics in an appendix for anyone who wants to dig in.
A few habits that make social media reporting KPIs land with leadership:
- Open with the business result, then show the social activity that drove it
- Use charts and trend lines instead of raw tables wherever you can
- Include industry benchmarks so your numbers have context
- Name one decision you want leadership to make based on the data
Perch can build and schedule these reports for you, pulling KPI performance across every connected account into a format you can share directly.
How many KPIs should I track for social media?
You should track 3 to 5 core KPIs per business objective to stay focused without getting overwhelmed. Tracking too many KPIs dilutes your team’s attention and makes it harder to act on insights.
What’s the difference between social media KPIs and vanity metrics?
KPIs are tied to business outcomes and help you make strategic decisions. Vanity metrics are numbers that look impressive but don’t connect to meaningful results.
How often should we review social media KPIs?
Review your KPIs weekly for tactical adjustments, monthly for strategic evaluation, and quarterly to reassess whether the KPIs themselves still match your goals. Weekly check-ins help you catch performance dips early and optimize ongoing campaigns.
Can I track social media KPIs without paid tools?
You can track basic KPIs using native platform analytics on Facebook, Instagram, LinkedIn, TikTok, and X. Each platform defines and reports metrics differently, though, so managing multiple accounts manually is time-consuming and makes cross-platform comparison difficult.
How do I choose the right KPIs for my organization?
Start with your business objectives and work backward. If your goal is lead generation, track conversion rate, cost per lead, and click-through rate on CTAs.
What should I do if my KPIs aren’t improving?
If your KPIs aren’t improving, first verify you’re measuring the right metrics for your goals. Then analyze your content performance to identify what’s underperforming and why, and check your targets against industry benchmarks in case the goal itself was unrealistic.
What is the 70/20/10 rule for social media?
What is the 5:3:2 rule for social media posts?
What is a good engagement rate on social media?
How do I report social media KPIs to leadership?
The #1 social media tool