Essential productivity kit for .NET and game developers
Releases Rider
Rider 2026.3 brings improvements to the workflows you rely on to write, run, and debug games. This release connects Rider more closely with the Godot Editor, improves debugging for Unreal Engine and custom C++ engines, adds support for Unity CoreCLR Players, and introduces new Lua and Verse plugins in Beta.
Here’s what’s new for game developers.
Lua and Verse: New language plugins in Beta
Lua: Work with scripts alongside your C++ or C# code
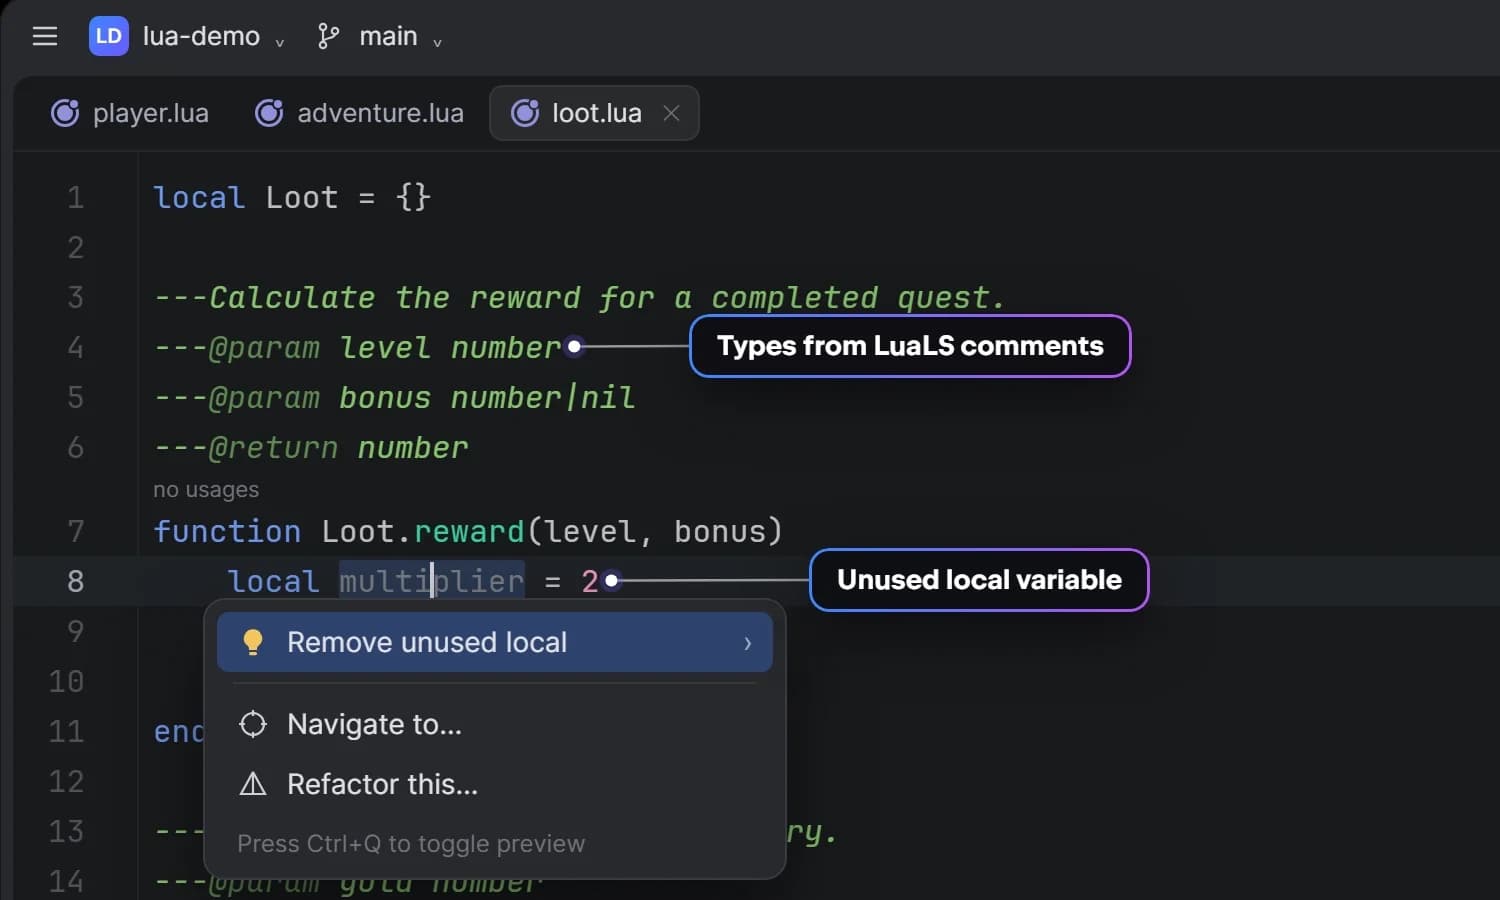
If your project combines C++ or C# with Lua scripts, this release will streamline your workflow, as the new JetBrains-maintained Lua plugin lets you work with both in Rider.
The plugin supports Lua 5.1–5.4, LuaJIT, and Luau, with:
- Code completion, documentation, parameter information, and inlay hints.
- More than 35 inspections with quick-fixes.
- Navigation, Find Usages, call hierarchy, and require path resolution.
- Refactorings such as Rename, Extract Function, Inline, and Change Signature.
- A configurable code formatter.
It also understands existing EmmyLua, LuaLS, and LDoc comments, as well as Luau type annotations, so you can keep the annotations your project already uses.
Search for Lua in Settings | Plugins | Marketplace to install the Beta.
Verse: Native language support
The new Verse Language plugin uses Rider’s own language engine to offer Verse support without requiring an external language server.
It provides syntax highlighting, error detection, code completion, navigation, Find Usages, and Quick Documentation. These capabilities are also available to AI agents through Rider’s MCP server.
For Unreal Engine 6 projects, you can open a .sln or .uproject file to work with C++ and Verse in the same project. For a lighter, Verse-focused setup, open the generated .code-workspace file.
The plugin is available in Beta through JetBrains Marketplace. Cross-language navigation between C++ and Verse is not yet supported.
Command-line argument presets: Keep your launch scenarios ready
With different maps, log levels, and test flags, you often have to run the same game with different arguments.
Rider’s built-in command-line argument presets replace the EzArgs plugin. Create a shared list of arguments, organize them into presets, and choose a preset from the main toolbar before running or debugging.
Presets are independent of run configurations, so you can reuse the same arguments across Debug and Release builds. Arguments support types and validation, and you can toggle individual arguments or entire folders.
Already have a command line saved in EzArgs or elsewhere? Paste it into Import Args from Command Line to split it into arguments and detect their types automatically.
You can share presets through version control or move them between projects using XML import and export.
Godot: Bring your editor, code, and scene together
Debug the scene you’re working on
Rider and the Godot Editor now have a live connection, making it easier to switch between your code and the scene you’re building.
You can debug the current scene in C# or GDScript. If you use C#, the scene launches through the Godot Editor with Rider’s debugger attached from the first frame. You can use Godot’s embedded game window to pause execution or adjust game speed while Rider handles your breakpoints.
You can also right-click a file in either application to open it in the other.
To enable the connection, install and enable the JetBrains Rider Integration add-on from the Godot Asset Store. The connection service itself ships with Rider.
See your scene in the debugger
A variable’s value is only part of the picture when you’re investigating a gameplay bug. You also need to understand where a node sits in the scene and what’s happening around it.
Rider 2026.3 brings Godot-aware debugging to both C# and GDScript. When execution pauses at a breakpoint, you can explore autoloads, the active scene, and its node hierarchy in the live scene tree, then inspect node properties. Nodes display their Godot names and types, making them easier to identify.
GDScript debugging also gains variable inspection on hover, Add to Watches, and code completion for expressions in the Immediate window. Large arrays and dictionaries can be explored page by page.
The scene tree appears when you hit a breakpoint in a Godot debug session. No additional setup is required for that view.
Unity: Debug CoreCLR Players
Trying Unity’s new runtime? Rider 2026.3 supports debugging CoreCLR desktop Players in Unity 6.7. Attach to a Player, set breakpoints, and step through your code using the familiar Rider debugger.
CoreCLR Players are an experimental technical preview in Unity. The Unity 6.7 Editor, including Play mode, still uses Mono. Rider also includes early support for developers testing the CoreCLR-based Editor in Unity 7 Alpha.
There’s more planned for Unity developers: Unity for Agents is coming in Rider 2026.3.1. Stay tuned for a closer look.
Unreal Engine and custom C++ engines: Spend less time getting back to the bug
Update Natvis visualizers without restarting
Natvis visualizers make complex engine types easier to read in the debugger. But adjusting a visualizer has traditionally meant stopping the session, relaunching the game, and reproducing the same state.
With Natvis hot reload, you can edit a loaded .natvis file and reload it during the active debug session. The Variables view updates without restarting the game.
This release also improves expression evaluation and Natvis rendering, including more reliable inspection of Unreal Engine’s TMap and TSet containers, support for additional expressions and visualizer elements, and faster debugger startup for Unreal Engine projects.
Step through C++ code more smoothly
On Windows, Rider now uses a native stepping implementation for C++ code built with MSVC, including Unreal Engine projects. Step Into, Step Over, and Step Instruction are faster and more consistent.
The update also fixes issues that were causing stepping to stop at the wrong locations or leaving internal breakpoints behind, resulting in unexpected stops.
Find what changed a value
When a value changes unexpectedly, a data breakpoint can help you find the code responsible.
You can now set one by right-clicking a variable directly in the editor, or add it through the Breakpoints dialog using a variable name or memory address. Conditions, logging, and read/write access triggers are supported.
AI agents can also set data breakpoints through the Rider MCP server, giving you another way to investigate unexpected memory changes together with your agent.
Try the new LLDB 21 debugger
Rider 2026.3 introduces an experimental debugger built on LLDB 21. It combines the latest upstream LLVM fixes with JetBrains’ debugger enhancements, including MSVC support, Natvis rendering, and Rider’s custom expression evaluator. The experimental debugger is available on Windows, macOS, and Linux.
The default debugger depends on your platform. On Windows, Rider continues to use JetBrains’ customized LLDB 9. On macOS, Rider already ships with upstream LLDB 21, but without JetBrains’ custom enhancements. The new experimental option brings these enhancements to a common LLDB 21 foundation across all three platforms.
You can download and select the experimental build in the Debugger settings. Try it with your projects and share your feedback.
Keep your C++ project structure consistent with Visual Studio
Are you moving from Visual Studio to Rider or working with teammates who use both? Experimental support for .vcxproj.filters keeps your C++ project’s logical structure synchronized between the two IDEs.
For Unreal Engine and other C++ projects, this helps preserve the project organization your team already uses when switching between Rider and Visual Studio.
More improvements for your day-to-day work
Beyond engine-specific updates, Rider 2026.3 brings:
- More responsive editing while opening solutions or switching branches, and faster access to highlighting, search, and navigation when reopening a solution.
- A Files view for browsing and editing repository files outside your solution, including build scripts, CI configuration, and documentation.
- Improved Git worktree support, including the ability to copy local project settings and run configurations into new worktrees.
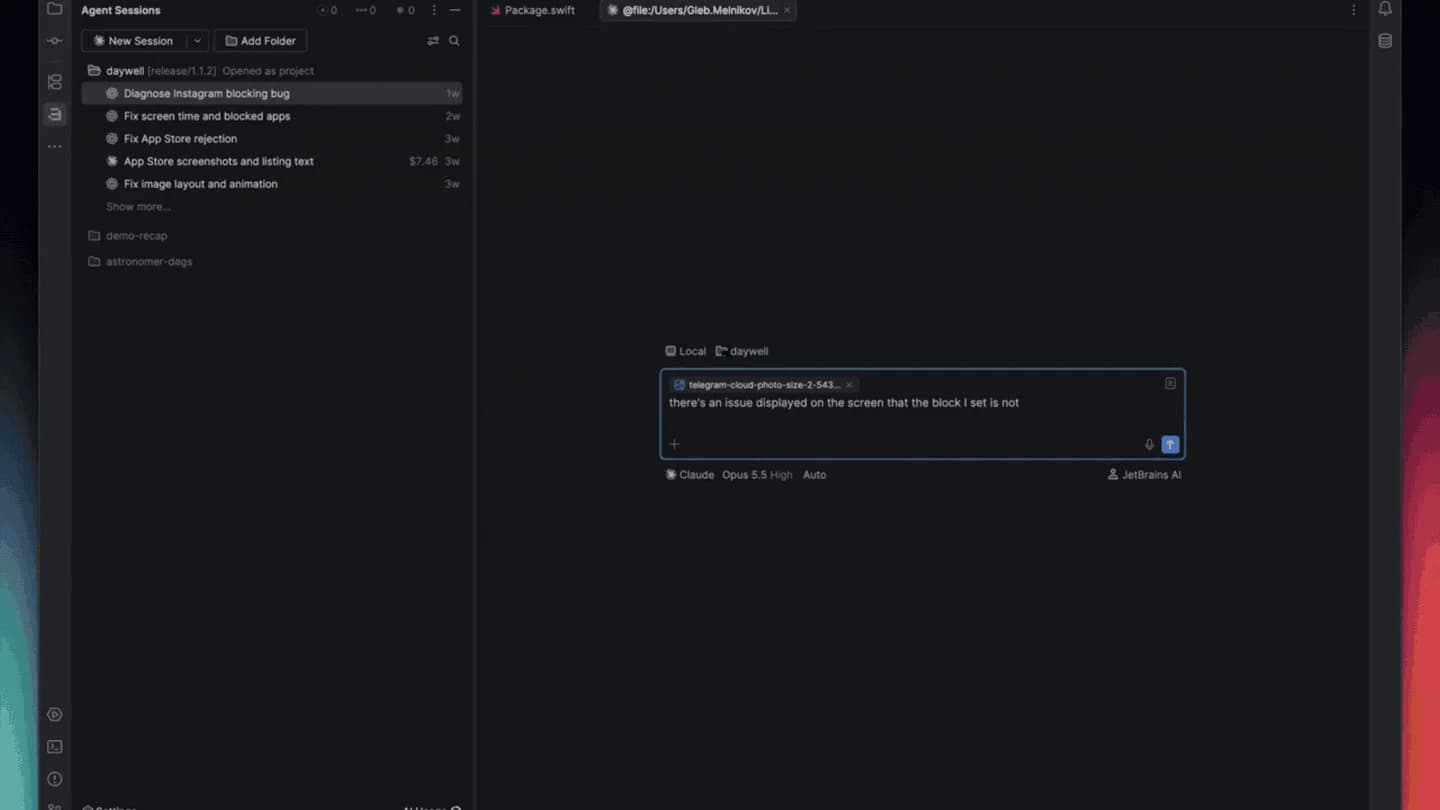
- JetBrains Air, a workspace for running coding agents and reviewing their changes inside the IDE.
Try Rider 2026.3
Update through the Toolbox App or download Rider to try the new game development features.
Rider is free for non-commercial use. To explore its support for your engine and workflow, visit Rider for Game Development.
We’d love to hear how these updates work in your projects. Share your feedback in the comments or report issues in YouTrack.