Focus on what matters
Rust is a great language for many reasons: safety, performance and tooling. However, debugging is maybe one of the weakest points still. Interestingly enough, the Rust debugging survey 2026 results show that the majority (53.2%) of Rust users don’t use a debugger at all. Many Rust developers (81.3%) say that prints are simply easier/faster. The setup is also another problem: many users find it difficult to set up a debugger and it’s not a beginner-friendly feature. Especially when you include async (28.1%) and macros (23.0%), stepping features break most of the time.
However, the situation is still better than it was in 2021, when the survey was first conducted. The number of users who use a debugger has increased from 36% to 46.8%!
This made me think: how is the debugging experience in Rust today?So let’s dive into the techniques and tools that are available and how they are used in practice.
The Scenario
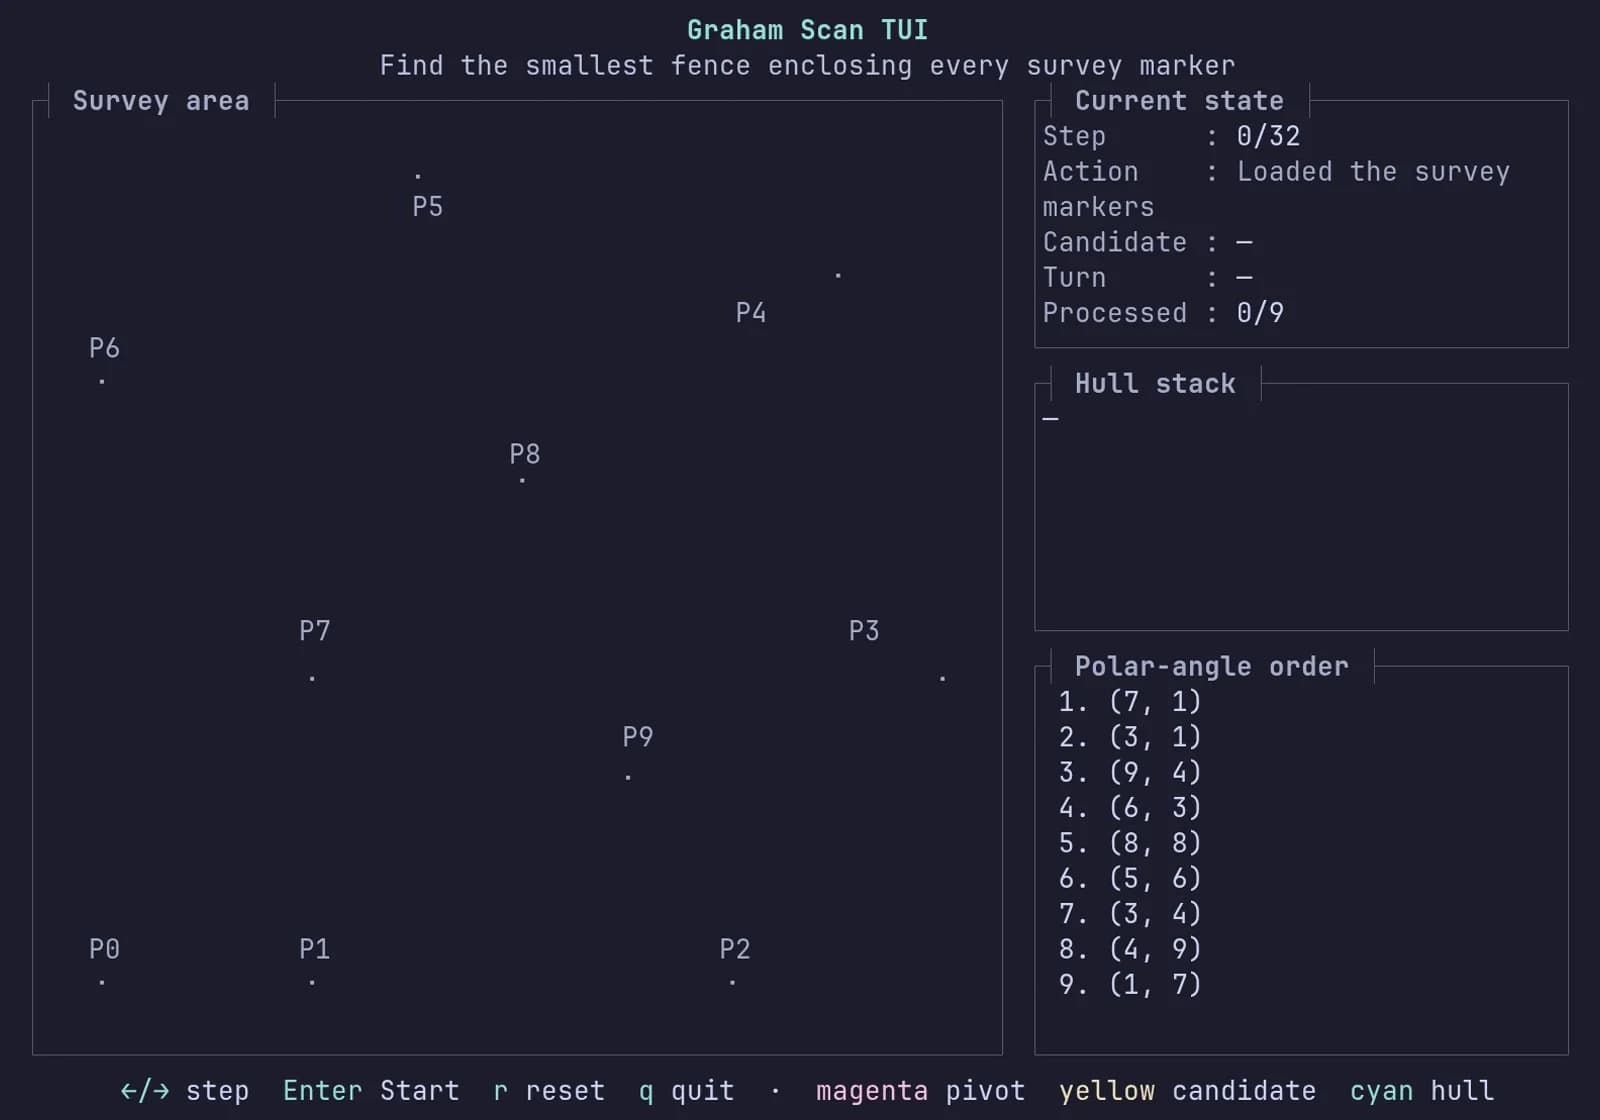
We will be using the Graham scan algorithm as an example. The algorithm computes the convex hull of a set of points in a plane: the smallest convex shape that encloses every point. Basically, you can think of it as stretching a rubber band around a collection of nails.
🐀: Here, I built a TUI with Ratatui to visualize the algorithm and the bug:
🐀: Here, I built a TUI with to visualize the algorithm and the bug:
The source code is available on GitHub.
You can see that it fails to enclose P2: the computed fence is red while the expected fence is green. Now, let’s go through the available debugging techniques to fix it!
1. println!, dbg! or tracing
There is already a unit test that fails, so we can use it as a debugging loop. Simply add println! or dbg! statements to the code and run the test until we find the bug.
Here, we print the intermediate ordering, rerun the failing test and see that points with the same polar angle are ordered farthest-first. Reversing the distance comparison fixes the ordering and the next test run passes.
This is the most common way of debugging in Rust and it works well for small programs. However, you see the problem: it is an iterative and tedious process. You need to recompile and run the program every time which takes time. It is also not ideal for big projects. It still works though!
🐀: What else?
🐀: What else?
2. rust-gdb or rust-lldb in the terminal
We can inspect the same failing test without changing the source code via rust-lldb or rust-gdb:
From there, we set breakpoints, run only the failing test and inspect the current frame:
At the breakpoint, a is 36 units squared from the pivot while b is only 4. The comparator uses b.cmp(a), so points with the same polar angle are sorted in reverse distance order.That is the bug: the farther point is processed first and later removed from the hull.
So let’s apply the fix:
We can also use the TUI to visualize it:
🐀: Yay, the rubber band is now wrapped around all the points.
🐀: Yay, the rubber band is now wrapped around all the points.
Unlike print debugging, this lets us inspect more state without editing and recompiling the program after every question. The trade-off is a manual workflow: setting useful breakpoints and knowing which debugger commands to run.
🐀: Okay, but is there a more friendly way to debug this?
🐀: Okay, but is there a more friendly way to debug this?
3. RustRover’s debugger
RustRover is JetBrains’ cross-platform IDE built specifically for Rust. It integrates Cargo projects, tests, code analysis and debugging in one place (and it is free for non-commercial use!).
The recommended way to install it is through the JetBrains Toolbox App, which also handles updates and lets you switch between stable and early-access-preview versions.
RustRover provides a graphical interface for GDB and LLDB, which means we can use the same workflow as before but with a more user-friendly interface. Click the gutter to set a breakpoint, then click the debug icon next to the failing test.
The RustRover debugger documentation covers custom configurations, stepping, watches and expression evaluation in more detail!
🐀: Interesting… I thought this type of debuggers are only available for more mature languages like Python or Java. How does it work under the hood?
🐀: Interesting… I thought this type of debuggers are only available for more mature languages like Python or Java. How does it work under the hood?
Good question! There is actually some interesting Rust-specific machinery behind the debugger. In my Rust in Production episode with Matthias Endler, I explained how RustRover turns the source into its own PSI, then a typed high-level representation and finally MIR. When we evaluate a Rust expression or call a function during a debug session, RustRover lowers it to MIR and sends it to the debugger to execute against the paused process.
🐀: So the debugger actually understands the Rust expression we are asking it to evaluate! Amazing.
🐀: So the debugger actually understands the Rust expression we are asking it to evaluate! Amazing.
Bonus: AI-assisted debugging
Recently we started to see the “AI-assisted” prefix in many things… programming, writing, ordering food, etc. and I thought why not try it for debugging as well?
🐀: So basically ask the agent to fix the bug for us?
🐀: So basically ask the agent to fix the bug for us?
Not exactly. The agent is not a replacement for the debugger, but it can help us understand the problem and suggest fixes. Instead, we will ask the agent to debug the problem and watch it in action with RustRover’s debugger!
Starting with RustRover 2026.3, the IDE’s integrated MCP server (Model Context Protocol) can expose the debugger to agents such as Codex and Claude Code. This means that instead of clicking around manually, the agent can start a debug session, set breakpoints, step through the program, read variables and evaluate expressions for us. See what’s new in RustRover 2026.3 for the full release highlights!
Starting with RustRover 2026.3, the IDE’s integrated MCP server (Model Context Protocol) can expose the debugger to agents such as Codex and Claude Code. This means that instead of clicking around manually, the agent can start a debug session, set breakpoints, step through the program, read variables and evaluate expressions for us. See what’s new in RustRover 2026.3 for the full release highlights!
Simply open Settings → Tools → MCP Server, enable the server and click Auto-Configure next to your agent. Restart the agent afterwards and you’re set!
Also, see the agentic debugging documentation for more details.
Once the MCP is connected, we can give the agent a goal like this:“Debug and fix this problem with RustRover MCP “
The result is:
🐀: Oh cool, you’re running Codex inside RustRover with the new Air plugin, and we can watch it run the failing test, set breakpoints, inspect runtime values and fix the bug!
🐀: Oh cool, you’re running Codex inside RustRover with the new Air plugin, and we can watch it run the failing test, set breakpoints, inspect runtime values and fix the bug!
Conclusion
Rust debugging isn’t one workflow. You can use println!, rust-lldb, RustRover or even an AI-assisted debugger. Each has its own trade-offs and is suitable for different scenarios.
🐀: Just pick the tool that works for you!
🐀: Just pick the tool that works for you!
If you’d like to watch this in action, check out the video version of this post, recorded at Rust Berlin Meetup:
Cheers! 🧀