Rider TeamCity
At GameDev Day 2026, TeamCity solutions engineer Artem Rokhin demonstrated how to investigate a CI issue from Rider using the TeamCity CLI and MCP integration.
For the demo, he used a Unity game that worked locally but was missing its background on staging. Though the build had passed, Artem used the CLI to inspect the logs and found an incorrect build parameter.
After committing his fix, he asked an AI agent connected through MCP to explain the issue and follow the new build.
Let’s go through that example, with the commands and setup you’ll need to try it with your own project.
The problem on staging
In Artem’s demo, a Unity game works locally but is missing its moon landscape on staging, despite a successful TeamCity build. He traces the deployment back to its build and checks the logs and configuration to see where they differ from those in his local setup.
What you need
To apply this workflow to your own project, you need:
- A Unity project open in Rider.
- A TeamCity pipeline that builds and deploys the project, with its YAML settings stored in the repository.
- Access to that pipeline’s build details and logs.
- The TeamCity CLI installed on your machine.
- For the AI portion, an activated MCP-capable agent in Rider and access to TeamCity’s MCP endpoint. Artem uses Claude Agent.
The recording uses TeamCity Cloud. TeamCity On-Premises users can use 2026.2 as a baseline with generally available Pipelines. See the Pipelines documentation for setup and version details.
The commands below use example IDs. Replace MyGame_BuildWebGL with your WebGL job’s ID, 12345 with the build you are investigating, and 12346 with the new deployment run when you reach that step.
Connect the TeamCity CLI from Rider
Open Rider’s terminal and install the TeamCity CLI if you have not already done so. On macOS with Homebrew:
On Windows with WinGet:
Other installation methods are available in the Getting Started guide.
Connect to your server and check the connection:
Replace the URL with your own TeamCity address. Follow the login flow, which may open your browser for authorization. The authentication documentation covers the available methods.
Once connected, return to Rider’s terminal to inspect the build.
Find the build that produced the game
List recent runs of the WebGL job:
Choose the run that produced the version on staging. Include successful runs in your search: In this example, the relevant build is green.
If several runs have completed recently, check the deployment’s source build and revision before investigating. The most recent WebGL build may be newer than the version you have open in the browser.
Inspect the selected run:
In the recording, Artem starts with the pipeline run, identifies its WebGL job, and then opens that job’s build details. Going directly to the WebGL job’s recent runs is a shorter route when you already know which job produced the game.
Inspect the logs and the configuration
Read the WebGL build log:
The default log viewer supports search. Press /, enter a term, and use n or N to move between matches. Full command details can be found in the guide to managing runs.
Artem has recently been working with build flavors, so he searches for flavor. The log shows that the build used gameBuildFlavor with the value diagnostic.
That provides a specific setting to investigate. Search the checked-out project for gameBuildFlavor, including both the pipeline configuration and the Unity build code that uses it.
The value printed in the log tells you what the CI build actually received; the repository helps you trace where it came from and what it controls.
In this demo project, the expected flavor is game. The diagnostic value is associated with the version missing its background. These names are part of the example project’s build setup; your project may use a different parameter or no flavor switch at all.
When you follow a similar lead, check both the definition and the code that consumes the value. Finding an unexpected parameter is useful evidence. Understanding its effect on the build lets you judge whether changing it addresses the symptom.
Commit the configuration change
Artem finds the diagnostic value in the pipeline’s YAML configuration and changes it to game. Because the configuration lives alongside the game code, he can review and commit the change from Rider.
TeamCity is configured to watch the repository, so pushing that commit starts a new pipeline run. You do not need to restart the old build manually in this setup.
For your own pipeline, check its trigger settings and confirm that the new run includes the configuration commit. Keep the original run ID so you can compare the settings and results afterward.
While the new pipeline runs, Artem shows another way to investigate CI results from Rider: an AI agent connected to TeamCity through MCP.
Connect Rider to TeamCity MCP
MCP gives the agent access to TeamCity tools, including tools for retrieving build logs and querying build information. The server endpoint is:
For this investigation, create a TeamCity access token limited to the relevant project with the Read-only preset. That is enough to inspect the CI results while you make the configuration change through Git. See TeamCity’s AI integration documentation for token permissions and connection options.
In Rider, go to Settings | Tools | AI Assistant | Model Context Protocol (MCP) and add an HTTP connection. A valid connection configuration should look like this:
Replace the server address and token placeholder in your private local configuration. Keep the token out of files you commit or share. Apply the configuration and check that Rider can connect. Our AI Assistant MCP guide describes the connection settings.
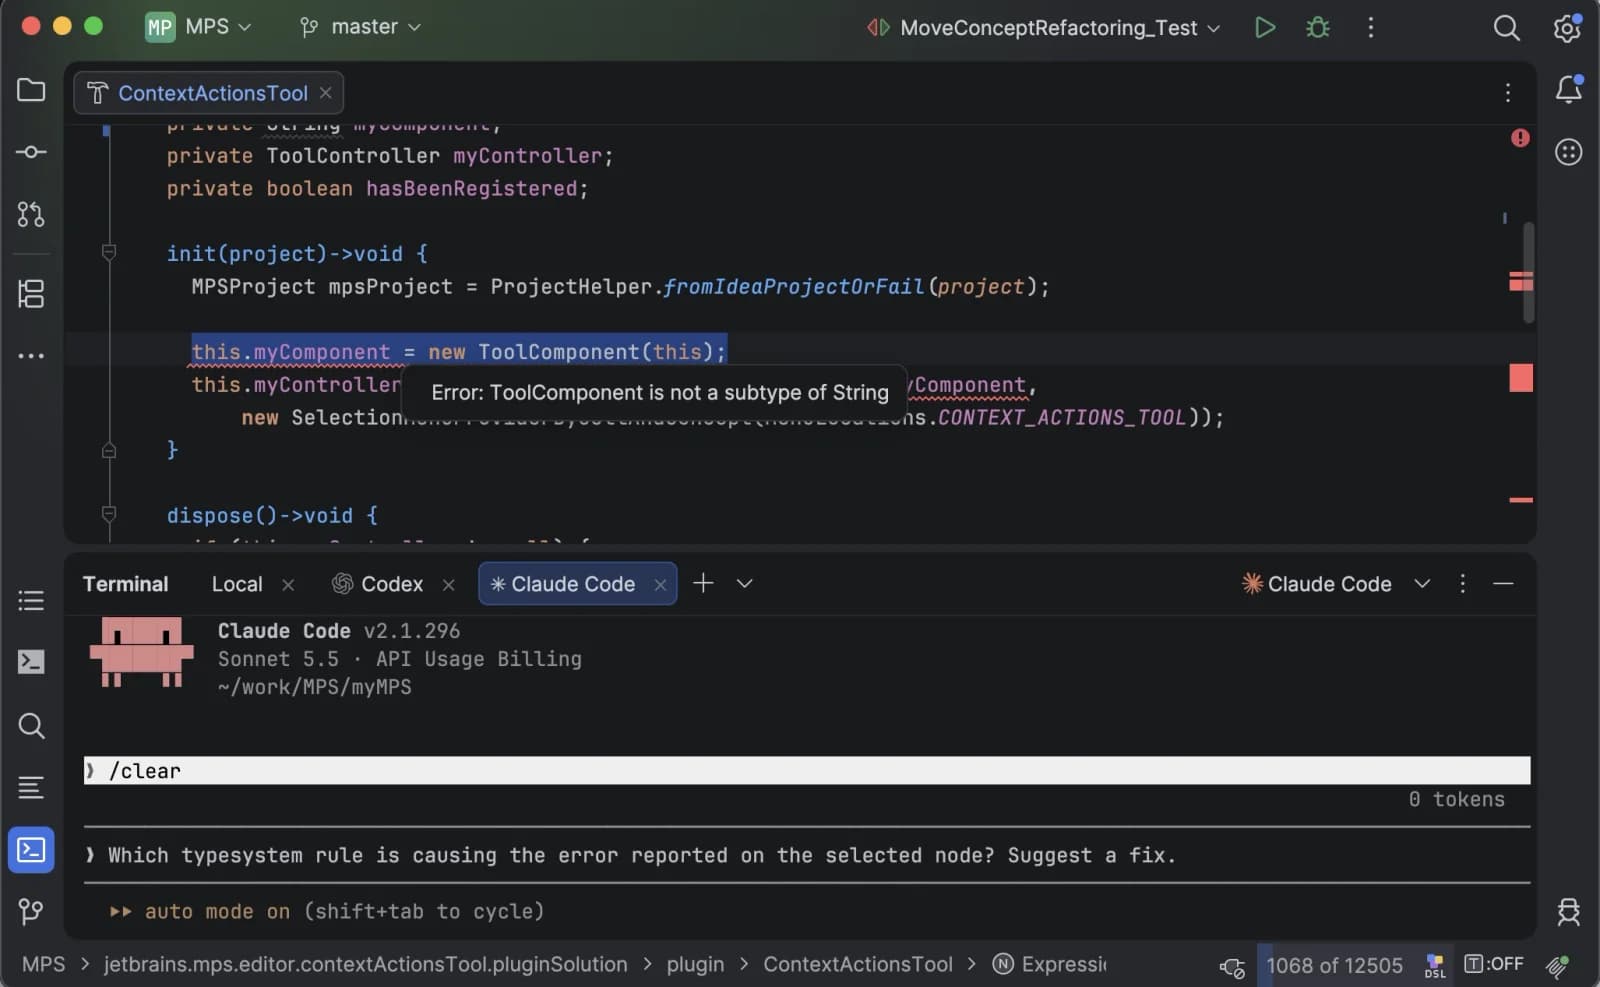
If you use Claude Agent, also open Settings | Tools | AI Assistant | Agents and enable Pass custom MCP servers. Then select Claude Agent in the AI chat. This exposes the configured connection to the agent, as described in the Claude Agent documentation.
Ask the agent to investigate the symptom
Give the agent the symptom and identify the build. For a similar investigation, you could adapt this prompt:
Replace the IDs before sending the prompt. Attach the relevant pipeline YAML and Unity build script if the agent needs help locating them. TeamCity MCP supplies the CI information; the coding agent uses its IDE and file tools to inspect the local project.
In the recording, Claude identifies the diagnostic build flavor and connects it to the unexpected game behavior. It also notices that the correction has already been committed. This part of the demo happens after Artem’s CLI investigation and manual fix, so the response can refer to that existing change.
Check the evidence in the answer. Does it refer to the run you asked about? Does the parameter value match the log? Does the explanation fit the code that consumes it? Those checks make it easier to assess the proposed cause before changing a different pipeline or project.
Follow the new deployment
Artem then asks the agent to check the new pipeline and return the staging URL when deployment finishes. The agent queries TeamCity during the active session and reports progress.
A follow-up prompt could be:
For continuous terminal updates, you can also watch the deployment run with the CLI:
Here, 12346 represents the new deployment build’s ID. Use the ID from your own pipeline. Once it completes, inspect its log if you need to retrieve the URL:
Verify the deployed game
Open the staging URL and repeat the interaction that exposed the problem. In Artem’s demo, the moon landscape is visible again, and the player can drive around it as expected.
This check confirms that the configuration change resolved the observed problem. The earlier run was already green, so another successful pipeline result alone would not establish that the background had returned.
For your own project, also confirm that you are viewing the deployment from the new run. Then compare the result with the local version that behaved correctly.
Make the next investigation easier
The example suggests a few useful improvements to the pipeline:
- Log the selected build flavor and other settings that change the game output, so they are easy to find.
- Validate the allowed flavors for staging builds in your project’s build script, and ensure that the run fails early when the value is unexpected.
- Add a check for the behavior that went wrong here. Depending on the project, that might be a WebGL smoke test that loads the relevant scene or a visual check of the deployed game.
Start with the missing check that would have caught this particular problem. That gives you a concrete way to improve the pipeline, along with a repeatable method for investigating its results in Rider.