If your team works in Microsoft 365, Excel is a natural place to start a project plan. The budget may already live in a workbook, and adding a tab for tasks feels like the obvious next step.
For a while, it works well. You can list tasks, plan dates around weekends, and turn the same rows into a status report, all in one file. Save the file to OneDrive or SharePoint, and everyone can edit it together.
But the workbook only knows what you’ve told it.
Every new dependency means another formula someone has to build and keep updating. And that’s the trade-off: Excel gives you real modeling power, and you pay for it in upkeep. This guide covers how to build a project tracker in Excel, turn it into a schedule and dashboard, and recognize when the workbook starts costing more effort than it saves.
TL;DR
Excel can run a real project if you set it up right. Start with one task table, build everything else from it, and switch to project management software if keeping the workbook updated takes more time than the project itself.
- Use Excel when one workbook holds the whole project, dates don’t shift often, and budgets or forecasts are a big part of the work
- Set it up with one task per row, working-day dates, a fixed list of statuses, and red flags for overdue work
- Build a Gantt-style timeline and a dashboard from the same table
- Watch for the tipping points, like dates you keep moving by hand, people stretched across several projects, and status reports you rebuild every week
- Move to project management software when the plan needs to coordinate people and handoffs as well as calculate dates
Excel Project Management: How to Plan and Track a Project in Excel
Can You Do Project Management in Excel?
Yes. Excel can handle the planning, tracking, and reporting behind a real project. You can map out tasks and owners, plan dates around weekends and holidays, and track status as work moves along. Because it’s a spreadsheet at heart, you can also model costs, sketch a Gantt-style schedule, and pull the same data into a dashboard in the same file.
That makes Excel a strong fit when one workbook can hold the whole project and the schedule stays fairly stable. It’s an even better fit when budgets, forecasts, or analysis are a big part of the job, since the same file can track the work and model the numbers behind it.
Excel starts asking more of you when tasks depend on each other and plans change. Like when a design review moves from Tuesday to Friday, and development can’t start until it’s approved. Excel will move the development date only if a formula already links the two. Each new dependency needs its own link, and before long, those formulas become part of the plan you’re maintaining.
The same upkeep creeps in when people split their time across several projects, or when someone has to rebuild the stakeholder update every week. It comes down to how much coordination you want the workbook to handle for you.
What to Decide Before You Open Excel
Before you build any formulas or timelines, take a few minutes to pin down what the project needs to deliver, who owns each part, and what the schedule has to work around.
Start with four decisions:
- The deliverables. Write down what needs to exist when the project wraps up. A deliverable like “Migrated customer database” gives the team a clear finish line to work toward
- The breakdown. Split each deliverable into tasks with a clear endpoint. A quick look at any task should tell you whether it’s moving, blocked, or done
- The owners. Give each task one accountable owner. Others can pitch in, review, or approve, but one person keeps it moving forward
- The constraints. Before you calculate anything, mark the fixed dates, limited availability, approvals, holidays, and dependencies that could affect the schedule
Once those are settled, Excel has something solid to work with. Our guide to setting project goals can help you define the outcome, and this breakdown of workstreams in project management can help you organize the work underneath it.
How to Build a Project Tracker in Excel
To build a project tracker in Excel, set up one task table with columns for owners, dates, and status, then build your working-day schedule, overdue alerts, Gantt chart, and dashboard from it.
Because every view pulls from the same task table, the workbook stays tied to one source of truth. The seven steps below walk through each part in order.
Step 1: Turn the task list into an Excel Table
Start with these columns: Task ID, Task Name, Workstream, Owner, Start Date, End Date, Working Days, Status, Percent Complete, Predecessor, Notes.
Enter the headers, select the range, and press Ctrl + T. Check that My table has headers is selected, then rename the Table Tasks from the Table Design tab so your formulas can refer to it by name.
That small step makes the rest of the workbook much easier to maintain. Enter a formula once, and Excel fills the whole column for you, while every new task you add becomes part of the Table automatically. Naming the Table also lets your formulas say “End Date” instead of “F2,” so they’re easier to read and don’t break when someone adds a column.
If you’re still getting comfortable with the basics, our guide on how to make an Excel spreadsheet covers the setup this section builds on.
Step 2: Keep one task on each row
Give each task its own row, and let the Workstream column show which phase or stream of work it belongs to.
Indented task names and blank rows between phases can make a sheet look tidy at first, but they get in the way once you start sorting, filtering, or building a PivotTable.
Give every task a permanent Task ID, too, so that if T-014 depends on T-009, you can enter T-009 in the Predecessor column. Row numbers change every time someone sorts the sheet, while the ID stays attached to the task no matter where it moves.
Step 3: Calculate dates in working days
Calendar days and working days answer different questions, since a task can span seven calendar days and still contain only five working days once you take out the weekend.
Create a Holidays sheet, list your non-working dates there, and name that range Holidays.
Then calculate the duration with:
=NETWORKDAYS([@[Start Date]],[@[End Date]],Holidays)
NETWORKDAYS counts the working days between the two dates and skips weekends and anything on your Holidays list.
If you already know the start date and the duration, you can calculate in the other direction:
=WORKDAY([@[Start Date]],[@[Working Days]]-1,Holidays)
When the start date is a workday, -1 counts it as day one. Leave it out, and a five-day task starting on Monday ends the following Monday.
Pick one approach: either type in end dates and let Excel count the days, or type in durations and let Excel work out the end date. Doing both in the same columns breaks the formula.
Excel stores dates as serial numbers behind the formatting. If a date shows up as a 5-digit number like 46026, the formula is fine. Change the cell format to Date before you rewrite anything.
Step 4: Standardize Owner and Status
Your team may read In Progress, in progress, and WIP as the same thing, while Excel counts them as three separate values and splits your totals accordingly.
Create a Lists sheet and add the statuses your team is allowed to use:
- Not Started
- In Progress
- Blocked
- Complete
Select the status list and name the range, such as Statuses. Then select the Status column, go to Data > Data Validation, choose List, and enter =Statuses in the Source. Repeat the process for Owner: list your team members on the Lists sheet, name that range Owners, and point the Owner column’s validation to it.
Keep the list short enough that each status tells the reader something distinct, and if two labels lead to the same next step, one of them can go.
Step 5: Make overdue work stand out
Once the team starts updating the tracker, conditional formatting can flag rows that need attention, so nobody has to scan each date by hand. To highlight overdue tasks, select the task rows and go to Home > Conditional Formatting > New Rule > Use a formula to determine which cells to format.
With End Date in column F and Status in column H, use:
=AND($F2<>"",$F2<TODAY(),$H2<>"Complete")
Choose a red fill, and from then on, any unfinished task with a past due date will flag itself each time the workbook recalculates.
To catch work that’s due in the next five working days and hasn’t started yet, add a second rule:
=AND($F2>=TODAY(),$F2<=WORKDAY(TODAY(),5,Holidays),$H2="Not Started")
Give that one an amber fill so it reads as an early warning. Keep the $ signs in place. They make every row check its own End Date and Status. Our guide to color coding in Excel covers the other rule types.
Step 6: Turn the dates into a Gantt-style schedule
Excel has no built-in Gantt chart type, but Microsoft’s workaround uses a stacked bar chart with hidden start dates, and it works well for a project tracker.
Add one helper column called Calendar Days:
=[@[End Date]]-[@[Start Date]]+1
Keep this separate from Working Days, because the chart needs the full calendar span, weekends included, to place each task in the right spot on the timeline.
Hold Ctrl and select Task Name, Start Date, and Calendar Days, then insert a Stacked Bar chart. Click the Start Date series and set its fill and border to No Fill to leave only the duration bars on the chart.
Next, open the vertical axis settings and turn on Categories in reverse order, so the first task appears at the top of the schedule.
If the bars bunch up on the right, open the horizontal axis settings and set the Minimum to your project’s first start date (Excel needs the date as a number here: type the date in any cell, change its format to General, and copy that number).
If you’d rather start from something ready-made, these Excel timeline templates give you a head start.
Step 7: Build the dashboard from the same Table
Give the dashboard its own sheet, and let the Tasks Table supply every number on it, so the report updates itself whenever someone changes the task list.
A few formulas cover the basics:
- =COUNTIFS(Tasks[Status],"Complete") for completed tasks
- =COUNTIFS(Tasks[End Date],"<"&TODAY(),Tasks[End Date],"<>",Tasks[Status],"<>Complete") for overdue tasks with a due date
- =SUMPRODUCT(Tasks[Percent Complete],Tasks[Working Days])/SUM(Tasks[Working Days]) for progress weighted by task length
- =COUNTIFS(Tasks[Owner],A2,Tasks[Status],"In Progress") for each person’s active tasks, with their name in A2
Because structured references expand as the Table grows, these formulas always cover the complete task list.
For a phase-level view, add a PivotTable grouped by Workstream. Because it draws from the Table, new rows show up the next time you refresh it, and you won’t have to reset the source range as the project grows.
Free Excel Project Management Templates
Microsoft Excel’s project management gallery offers free templates for Gantt plans, project trackers, timelines, and to-do lists. It’s the quickest way to get a working file in place before you add your own tasks. Current options include the Gantt project planner, the Project tracker, and several milestone and timeline templates.
A template saves you the setup, but check how the file behaves before you move your project into it. Look at three things first:
- How it handles dates. Check whether duration counts calendar days or working days, and whether weekends and holidays need extra setup
- What happens when you add a task. A structured Table carries formulas and formatting into new rows automatically, while a fixed range may need extending by hand
- Whether the timeline is tied to the task data. Microsoft’s Gantt chart templates build their bars from each task’s start date and duration, so the chart updates whenever the schedule does
Then trim the template to fit the project you’re running. If nobody will keep Risk, Estimated Hours, Cost, or any other field current, remove it before the sheet fills up with half-used columns.
If you want to compare a few more ways to structure your plan before building your own, this walkthrough covers free project planning templates for different types of work.
Where Excel Taps Out
Excel gets harder to maintain in four places, and each one adds formulas or manual steps someone has to keep up:
Rescheduling. A Predecessor column records that one task depends on another, and those dates stay connected only through the formulas you build behind them. Each downstream task needs a working link of its own, so as the schedule shifts, keeping those links intact becomes part of managing the project.
Handoffs and follow-up. An Owner column shows who holds the work, and co-authoring lets the team update the same workbook together. Passing the work to the next person, starting an approval, or creating the follow-up task still happens by hand. You can build automation around Excel with tools like Power Automate, and that setup becomes one more thing someone has to maintain.
Resource visibility across projects. One project file can show how much work each person has inside that project. The harder question is what those same people have committed to elsewhere. Once assignments are spread across several workbooks, you have to pull that data together before you can spot conflicting dates, available capacity, or someone who’s taken on more than they can finish.
Reporting effort. Excel can calculate the numbers behind a status report, but pulling updates from several files into one current picture still takes time. Hypergene’s Nordic PMO Reality Report 2026 surveyed 789 PMO managers, portfolio managers, and project leaders across Sweden, Norway, and Finland. It found that 83% work in hybrid environments that combine dedicated systems with spreadsheets and manual processes. Respondents also reported spending up to half a working week each month on manual reporting.
Grid size is rarely the problem. A worksheet holds 1,048,576 rows by 16,384 columns. The upkeep shows up long before you run out of space.
Grid size is rarely the problem. A worksheet holds . The upkeep shows up long before you run out of space.
Excel vs Project Management Software: How to Choose
Excel works best when dates move occasionally and the team can keep task relationships current by hand. Project management software earns its place when one change must automatically update connected tasks, people, and reports. The table below breaks that choice down by factor.
Plenty of teams run both. Excel handles budgets, forecasts, scenario modeling, and ad hoc analysis, while dedicated software manages dependencies, assignments, workloads, and day-to-day delivery.
When to Move From Excel to Project Management Software
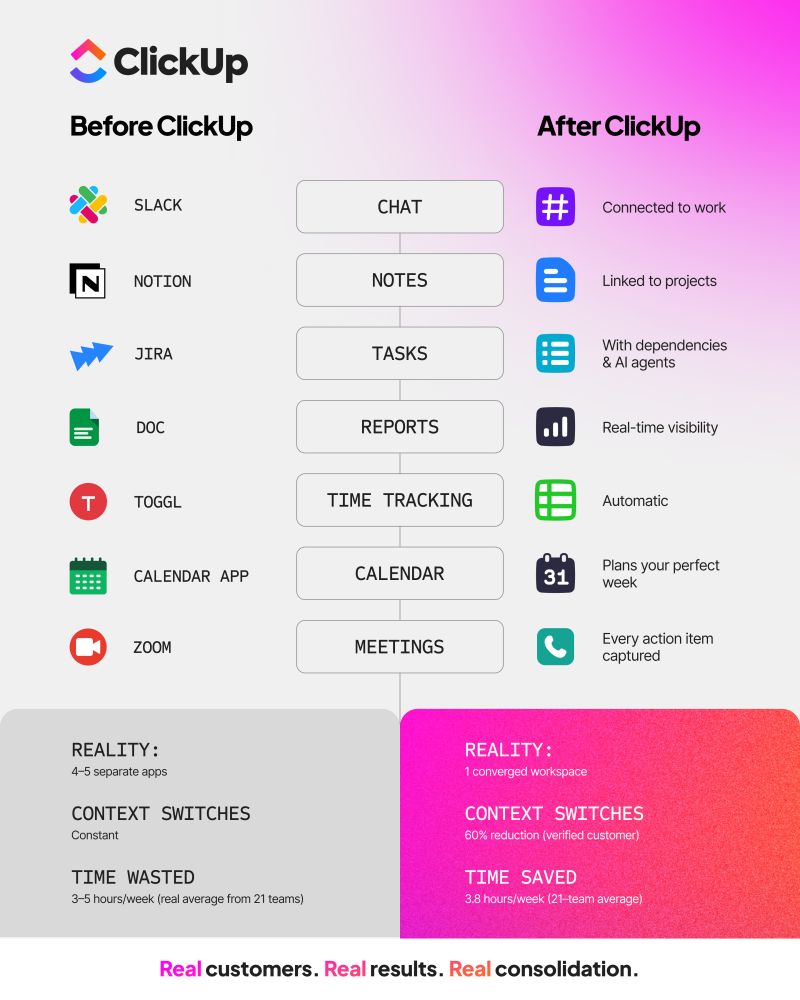
The case for project management software grows when the numbers on the Excel sheet also need to stay connected to people, dependencies, handoffs, and live reporting.
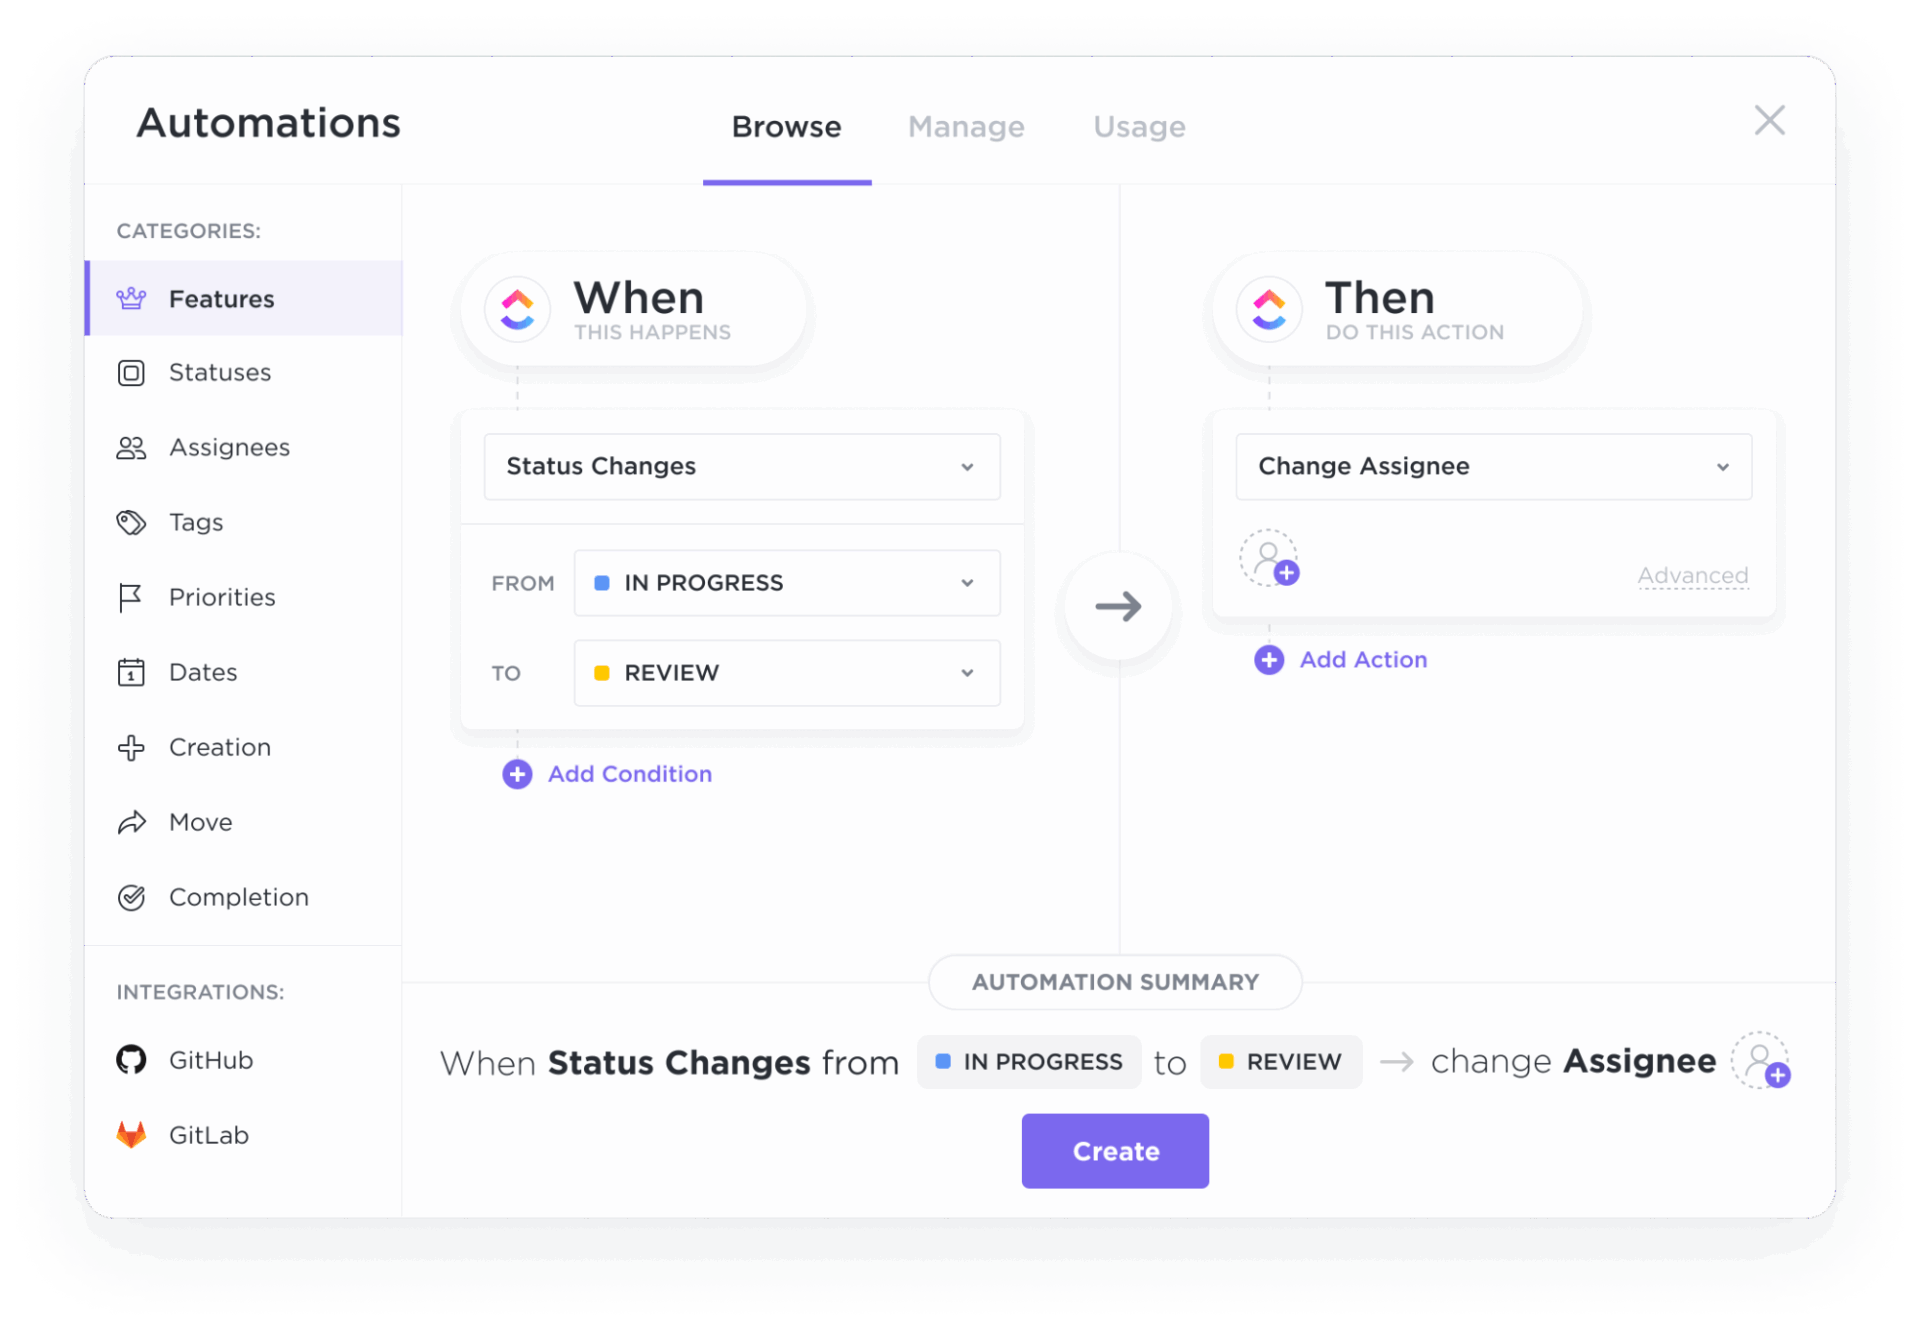
At that point, a work and project management platform like ClickUp is worth exploring. You can bring your existing Excel file over with the Spreadsheet importer and map its columns to task fields or Custom Fields.
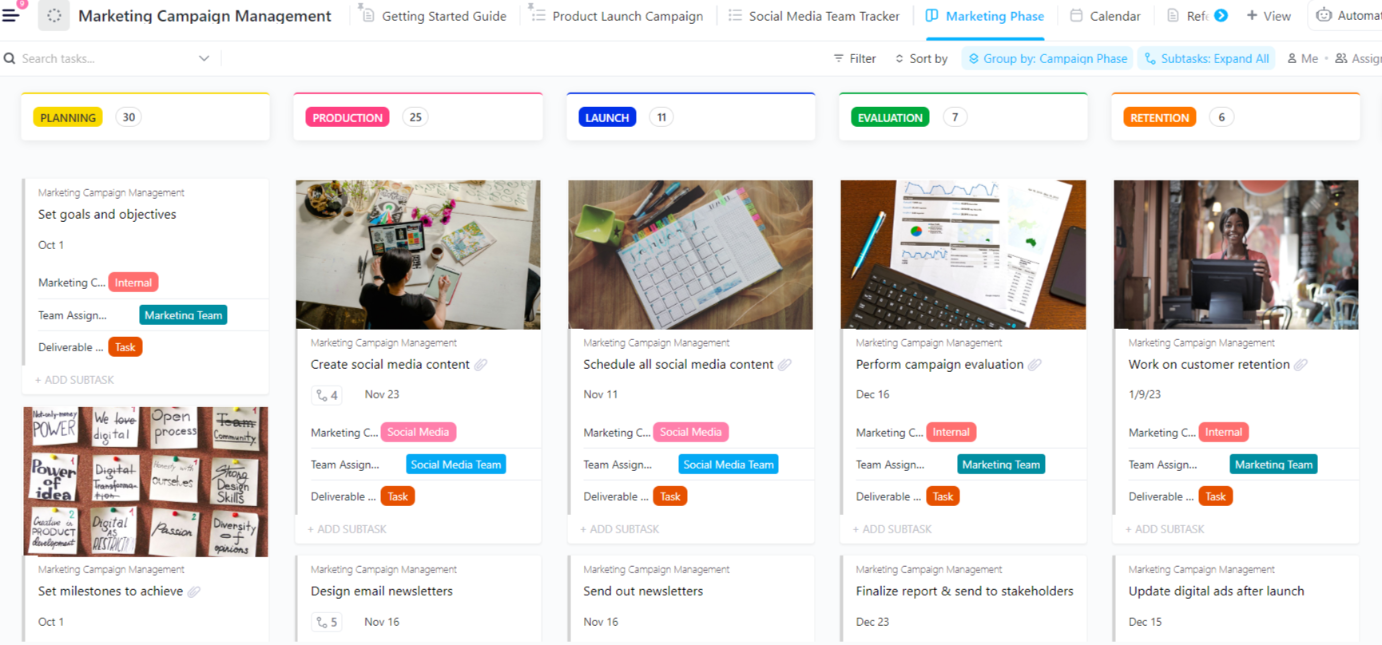
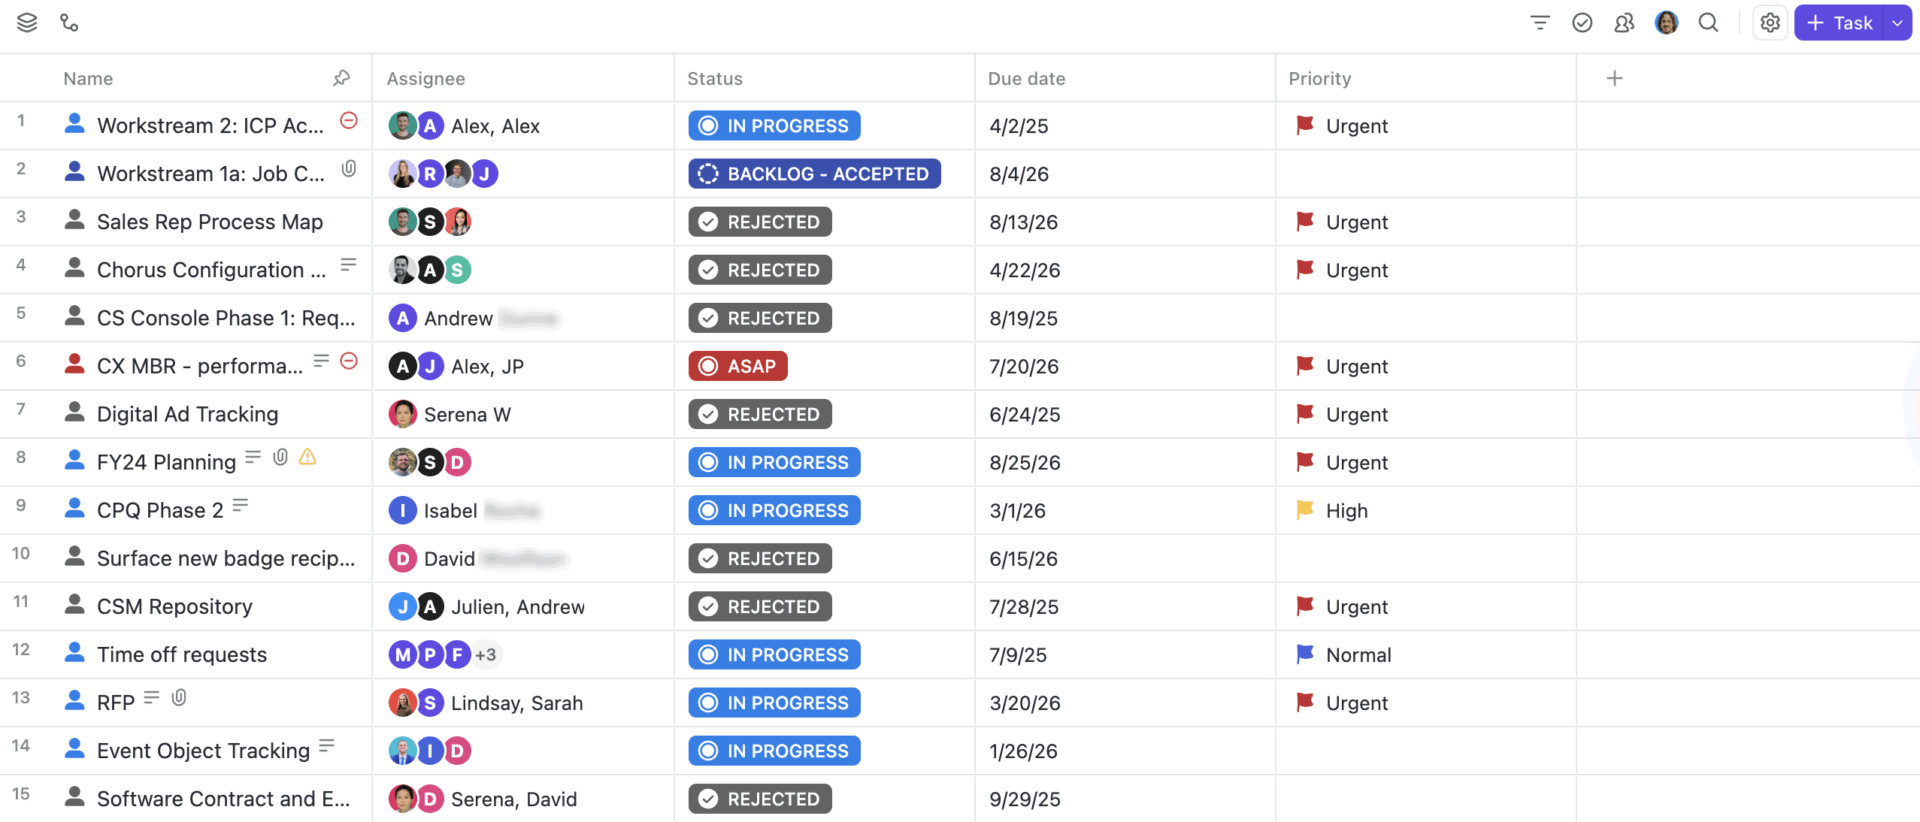
ClickUp Table View keeps the feel of Excel. Tasks appear as rows and fields as columns, with built-in sorting, filtering, grouping, custom fields, and bulk editing.
Each row is also a ClickUp Task, connected to its assignee, dates, status, dependencies, comments, docs, and every other view of the same work.
From there, ClickUp can take on the coordination work that gets harder to maintain in Excel:
- See work move through stages with ClickUp Board View. Arrange tasks as cards by status, then drag them from Backlog to In Progress, Review, Done, or whatever stages match your workflow. You can also group the board by assignee, priority, due date, or a Custom Field, all from the same set of tasks
- Map dependencies and schedule changes with ClickUp Gantt View and ClickUp Dependencies. Gantt View lays tasks across the timeline, while Dependencies connect work that needs to happen in sequence. When a blocking task moves, ClickUp can adjust downstream dates by the same amount. With non-working-day scheduling enabled, those shifts can also skip weekends, public holidays, and custom exceptions
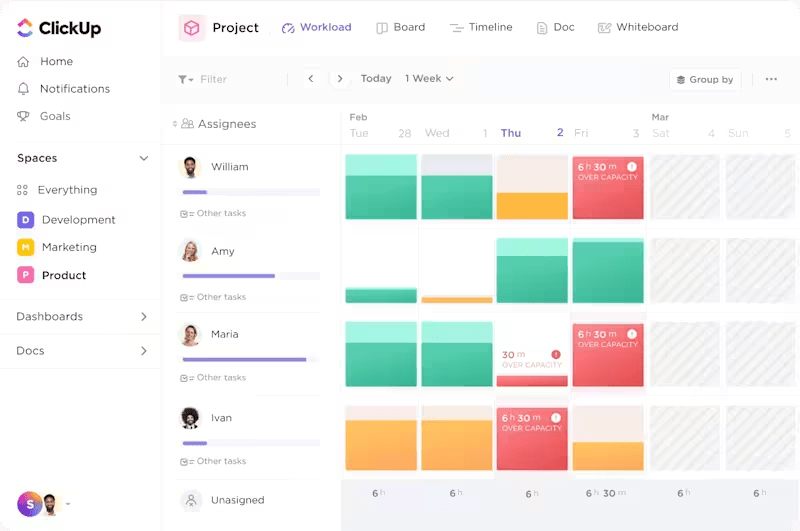
- Plan workload and capacity with Workload View. View assigned work by day, week, or month, and compare each person’s commitments with their available capacity. The Workspace work schedule provides the default capacity, while per-person capacity settings and time off can account for different days and hours across the team
- Keep handoffs attached to the work with ClickUp Chat and Assigned Comments. Turn a conversation into a task when something needs follow-up, or assign a comment to a specific person when feedback needs action. Assigned Comments stay open in that person’s queue until they’re resolved
- Report from live project data with ClickUp Dashboards. Bring charts, tables, workloads, time tracking, and calculations onto one dashboard. With a Task List card, you can also update statuses, priorities, assignees, and other task fields without leaving the Dashboard. The report stays tied to the work it describes, so it updates as the project does
- Use Brain² across the project context. Brain² works from your Tasks, Docs, Chat, connected apps, and other Workspace locations. Ask it for a project update, find work that’s stuck, or pull together context before a review, straight from the project itself
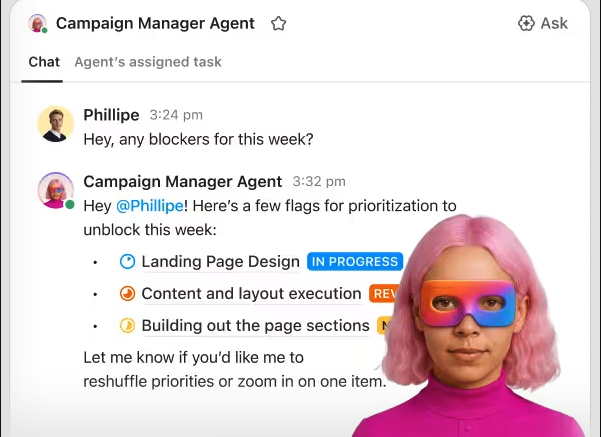
ClickUp Super Agents can take over some of the project checks that are hard to maintain in a workbook. The Project Timeline Builder Agent turns milestones, deliverables, constraints, and target dates into a sequenced project timeline with dependency logic. Once work is underway, the Scope Creep Detector Agent compares current work against the original project or sprint baseline and flags added tasks, expanded requirements, and other scope drift.
Where it taps out
ClickUp isn’t built to replace the financial modeling Excel does well. If your project depends on detailed budget models, multi-sheet forecasts, or what-if scenarios with complex formulas, keep that analysis in Excel and bring the tasks, owners, dates, and decisions into ClickUp. Moving an established workbook also takes some setup: mapping columns to fields, rebuilding statuses, and getting the team used to working from tasks instead of rows.
Best for: Teams running multiple projects, shared resources, dependencies, and recurring reporting that need project data to stay connected as plans change.
Skip it if: One Excel workbook already handles your project comfortably, and your team mainly needs budgeting, forecasting, or scenario modeling.
A Good Project Plan Should Survive Its Builder
Even a well-built Excel workbook can have one weak point: the person who understands how it works.
They know why a formula points to another sheet, which cells are safe to edit, what the red fill means, and which dashboard number needs a second look. While they’re around, the system feels obvious. When they take time off, change roles, or hand the project over, some of that know-how can leave with them.
A project plan holds up better when everyone doing the work can follow its logic. Ownership, dependencies, decisions, and next steps should be clear to anyone who opens the file. In Excel, a notes tab, named ranges, and plain-language column headers go a long way toward that.
As the project grows, ClickUp keeps that context with the tasks and the people responsible for them, so the plan is easier to pick up and hand over when the team changes.
Frequently Asked Questions About Excel Project Management
Can Copilot build a project tracker in Excel?
Yes, with an eligible Microsoft 365 or Copilot plan. Copilot in Excel can create and edit tables, formulas, charts, PivotTables, filters, and formatting from natural-language instructions. You’ll still need to define the project structure, such as which statuses, owners, dates, and reporting fields the tracker should use.
Can Microsoft Forms add project requests to Excel?
Yes. Microsoft Forms responses can feed into an Excel workbook stored in OneDrive or SharePoint. That works well for project intake, change requests, issue reporting, or other workflows where each submission needs to become a row for review.
Can Excel combine several project workbooks into one portfolio view?
Yes. Power Query can combine files with the same column structure into one table, including workbooks stored in a folder or SharePoint. Once set up, refresh the query as source files change instead of manually copying rows between projects.
Can Excel send project deadline reminders automatically?
Not from the workbook alone. You can pair Excel with Power Automate and Office Scripts to check a schedule on a recurring basis and send reminder emails when dates meet your conditions.
Can I let teammates see only their own tasks in Excel?
Not securely inside one shared workbook. You can lock cells, restrict editing, and hide rows, but hidden rows don’t keep data private from someone who can open the file. Microsoft also notes that worksheet protection isn’t intended as a security feature. If each person needs to see different tasks, separate files or a system with record-level permissions is safer.
Is Excel or Microsoft Project better for project management?
Excel is better for lightweight project tracking, budgets, forecasts, and scenario modeling. Microsoft Project is stronger when schedules depend on linked tasks, baselines, critical paths, and automatic rescheduling. In Project desktop, linked tasks update when a predecessor changes, and the tool supports several dependency types.
Microsoft’s cloud options have changed, too. Project for the web moved into Microsoft Planner in August 2025, and Project Online was retired on September 29 2026. Microsoft says Project desktop, Project Server, and Planner aren’t affected, and Planner’s premium plans now include portfolios, baselines, dependencies, and Gantt charts.
Can Excel calculate a project’s critical path?
Yes, but only if you build the scheduling logic into the workbook. A basic Excel Gantt chart won’t calculate the critical path on its own. You need task durations, dependencies, and float calculations to identify which tasks directly affect the project finish date.
Everything you need to stay organized and get work done.