If your Cypress suite has tests that fail more often or run slower, you know it can be hard to figure out the pattern from a single job. It could be one spec that slowed down, or a single test that fails, or maybe the entire suite is trending slower. The root cause could be a bug in the app, or a flaky test, or something else. Your terminal output and CI log will tell you what happened on a single run, but that doesn't help you spot any larger trends—especially since you lose that data as soon as the job finishes.
Thankfully, Cypress, a front-end automated test framework built for web applications, already exposes everything you need through its plugin hooks. After each spec finishes, Cypress hands you a results object with pass and fail counts, per-test durations, and states. You just need to turn that into metrics and ship it somewhere durable.
In this post, you'll learn how to monitor your Cypress tests by converting those results into Prometheus metrics inside a Cypress hook, pushing them to a Prometheus Pushgateway, and letting Alloy scrape the gateway and forward everything to Grafana Cloud Metrics—using nothing but the free tiers.
By the end you’ll have a pipeline running with the following architecture:
What you’ll need
This walkthrough runs everything alongside your existing Cypress project. Before you start, make sure you have:
- A Cypress project (this example uses Cypress 14.x) with a cypress.config.js you can edit
A Cypress project (this example uses Cypress 14.x) with a cypress.config.js you can edit
- A Prometheus Pushgateway. Cypress runs are short-lived batch jobs, so they can’t be scraped directly—the Pushgateway holds the metrics between runs so a scraper can pick them up. Set up a Prometheus Pushgateway in your infrastructure
A Prometheus Pushgateway. Cypress runs are short-lived batch jobs, so they can’t be scraped directly—the Pushgateway holds the metrics between runs so a scraper can pick them up. Set up a Prometheus Pushgateway in your infrastructure
- Alloy, our open source collector we use to scrape the Pushgateway and remote-write to Grafana Cloud
Alloy, our open source collector we use to scrape the Pushgateway and remote-write to Grafana Cloud
- A Grafana Cloud account. The free tier includes Grafana Cloud Metrics and a Prometheus remote-write endpoint. If you don't have an account, you can sign up here
A Grafana Cloud account. The free tier includes Grafana Cloud Metrics and a Prometheus remote-write endpoint. If you don't have an account, you can sign up
- Your Grafana Cloud remote-write URL, numeric user ID, and an access policy token with the metrics:write scope
Your Grafana Cloud remote-write URL, numeric user ID, and an access policy token with the metrics:write scope
Emit metrics from Cypress hooks
1a. The hooks that make it work
Cypress plugins run in Node.js and can subscribe to lifecycle events in setupNodeEvents. Two hooks give us everything we need:
- before:run fires once, before any spec runs. We use it to stamp a single run_id for the whole suite and to clear any state from a previous run. In this example run_id is the epoch timestamp of the test suite start time.
before:run fires once, before any spec runs. We use it to stamp a single run_id for the whole suite and to clear any state from a previous run. In this example run_id is the epoch timestamp of the test suite start time.
- after:spec fires after each spec file finishes and receives that spec’s results object. This is where the test counts, states, and durations live, so this is where we build and push metrics.
after:spec fires after each spec file finishes and receives that spec’s results object. This is where the test counts, states, and durations live, so this is where we build and push metrics.
The push is wrapped in try/catch so a monitoring outage never turns a green test run red—telemetry is a side effect, not a gate. Second, the run_id is set once in before:run and reused by every spec, so all the specs from a single suite execution share one identifier and can be grouped together later for each run.
1b. Turn a Cypress results object into Prometheus metrics
The results object Cypress passes to after:spec includes a stats block (passes, failures, pending, skipped, tests, and duration in milliseconds) and an array of tests, each with title, state, and duration. We map those onto a small set of metrics, using labels to slice by spec, run, and individual test:
Every series carries a common set of labelsspec (which file), run_id (the epoch stamped in before:run), and ci_run_id (the CI run, when present)—so you can filter a dashboard down to one spec or one CI run. The result is a compact set of metrics:
- cypress_tests_total: Count of tests by outcome (passed, failed, pending, skipped) per spec
cypress_tests_total: Count of tests by outcome (passed, failed, pending, skipped) per spec
- cypress_tests_run_total: Total tests executed per spec
cypress_tests_run_total: Total tests executed per spec
- cypress_spec_duration_seconds: How long each spec took
cypress_spec_duration_seconds: How long each spec took
- cypress_spec_success: 1 if a spec had zero failures; 0 if a spec had any failures
cypress_spec_success: 1 if a spec had zero failures; 0 if a spec had any failures
- cypress_test_success and cypress_test_duration_seconds: The same idea at the individual-test level, so you can trend one flaky test over time
cypress_test_success and cypress_test_duration_seconds: The same idea at the individual-test level, so you can trend one flaky test over time
1c. Push to the Pushgateway
A normal Prometheus setup scrapes long-running services on an interval. A Cypress run is the opposite. It's a short-lived batch job that exits before any scraper can reach it. The Prometheus Pushgateway exists for exactly this case: your job pushes its metrics to the gateway, the gateway holds them, and Prometheus (or Alloy) scrapes the gateway on its own schedule.
The push itself is a plain HTTP POST of the metrics in Prometheus text format:
The job and instance in the path form the Pushgateway grouping key (here, job="cypress" and instance="local"; which could be assigned with any values based on the project or module from your running suite).
Because we accumulate every spec’s metrics into a specMetrics map and re-POST the full body after each spec, the gateway always holds a complete, current snapshot of the suite. And clearing that map in before:run means a new run starts clean instead of carrying stale specs forward.
The whole integration lives in cypress.config.js and activates only when a PROMETHEUS_PUSHGATEWAY_URL is set, so local cypress run invocations stay untouched unless you opt in:
Ship to Grafana Cloud with Alloy
The Pushgateway now holds your metrics, but it’s a local buffer, not long-term storage. Alloy bridges the two: it scrapes the gateway and remote-writes to Grafana Cloud Metrics.
Provide your Grafana Cloud credentials as environment variables and start Alloy:
Run tests and verify
Start the Pushgateway and Alloy, then run your suite pointed at the gateway:
As each spec finishes, Cypress logs a line like Pushed metrics for spec "login.cy.js" (run_id="1753100000000") to Pushgateway. Within a scrape interval, those series appear in Grafana Cloud.
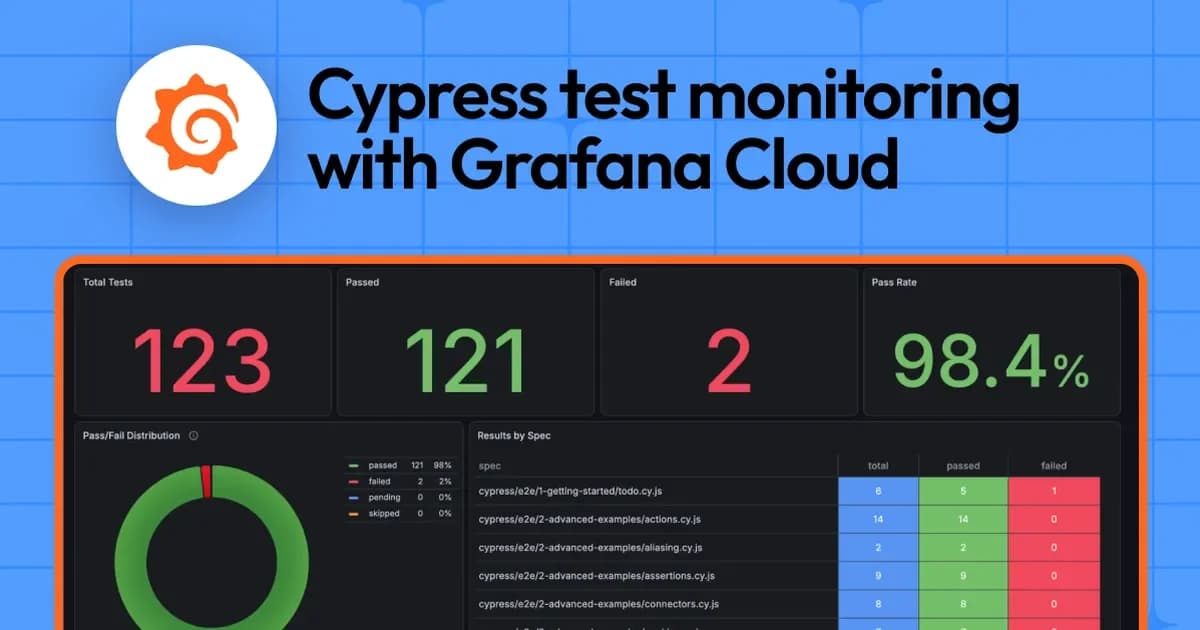
From here you can build a dashboard that identifies trends in pass and fail counts, spec duration, and per-test success. You can also set up Grafana Alerting to page you when the suite success rate drops or a critical spec starts failing.
Based on the collected metrics, we could visualize each spec’s execution time and also individual test’s.
Running it in CI
The same mechanism works unchanged in CI—the only difference is where the metrics come from.
For example, in a GitHub Actions workflow, set PROMETHEUS_PUSHGATEWAY_URL to a Pushgateway your runner can reach, and Cypress does the rest:
Because the code reads GITHUB_RUN_ID when it’s present, every CI run is tagged with its ci_run_id—so you can jump from a metric spike straight to the workflow run that produced it.
A few things that will save you time:
- Use a Pushgateway, not a scrape target. Cypress runs exit in seconds; a scraper would never catch them. The Pushgateway is the buffer that makes short-lived jobs observable.
Use a Pushgateway, not a scrape target. Cypress runs exit in seconds; a scraper would never catch them. The Pushgateway is the buffer that makes short-lived jobs observable.
- Never let telemetry fail the run. Wrap the push in try/catch. A monitoring outage should never turn a passing suite red.
Never let telemetry fail the run. Wrap the push in try/catch. A monitoring outage should never turn a passing suite red.
- Escape your label values. Test titles are free text and can contain quotes and newlines that break the Prometheus text format. Escape them before writing metrics.
Escape your label values. Test titles are free text and can contain quotes and newlines that break the Prometheus text format. Escape them before writing metrics.
- Stamp one run_id per suite. Setting it in before:run and reusing it across specs is what lets you group and compare whole runs later.
Stamp one run_id per suite. Setting it in before:run and reusing it across specs is what lets you group and compare whole runs later.
Grafana Assistant is the easiest way to get started with metrics, logs, traces, dashboards, and more in Grafana Cloud. We have a generous forever-free tier and plans for every use case. Sign up for free now!