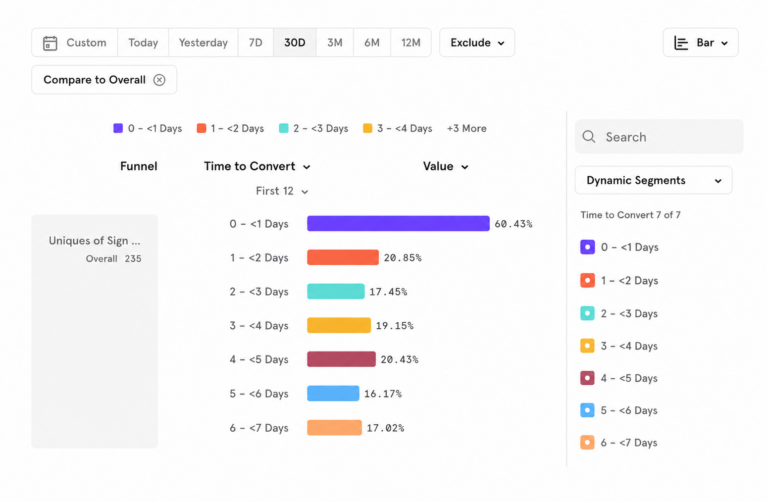
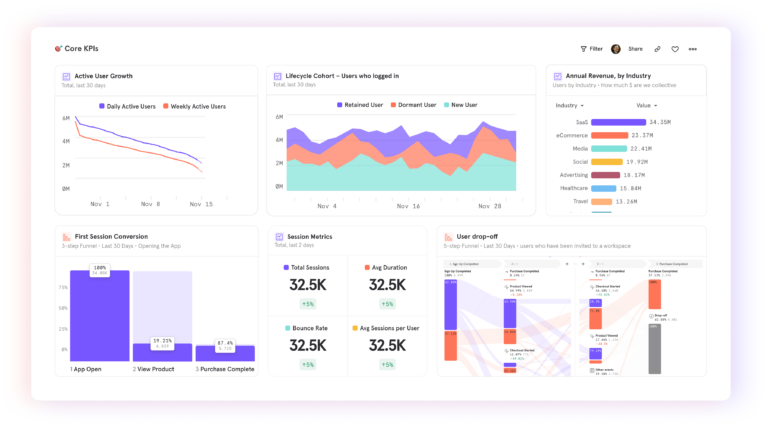
New today: Claude Dashboards. Use natural language to build a dashboard in Claude, then click to export it to Mixpanel.
Since we launched our MCP server and other AI features like Mixpanel Headless earlier this year, we're seeing usage of Mixpanel via Claude skyrocketing. It's becoming a common starting point for teams to ask questions of their data. Hearing our customers tell us how they’re using Claude and Mixpanel together gets us excited about the possibilities for making these workflows even better, so every builder has the insight they need to make products their customers love from wherever they already work.
Claude artifacts, backed by Mixpanel: A flexible starting point for telling stories with data
Mixpanel's behavioral data is the perfect building block to create rich stories about customers with Claude artifacts. As PM for Mixpanel’s MCP server, I spend a lot of time using Claude to interact with Mixpanel data. For example, I used Claude to create a weekly leaderboard, backed by Mixpanel data, to showcase our top MCP users and top AI clients integrated with our MCP. It was fun, with emojis indicating top rising customers and any health metrics that deserved attention.
We know that many of our top customers also do much of their work with Mixpanel from Claude, and like me, one of their most common workflows is building dashboards in Claude backed by Mixpanel data. You tell Claude what you're trying to understand, and a first draft appears, with layouts, annotations, and color coding built around your question. It's a fast, flexible way to get an idea in front of people.
These Claude artifacts are a great place to start, but the same three sticking points kept coming up for me:
- Digging deeper: A good dashboard answers one question and raises the next. Why did that cohort drop off? What did those users actually experience? Finding answers to these further questions takes Session Replay, experimentation, cohorts, and richer analyses like funnels, flows, and retention, which are all built for following up.
- Shared definitions: When a chart drives a decision, everyone needs to know what "active user" means and that it means the same thing every time. That takes governed data and shared metric definitions.
- Working together: Insights only matter when a team can act on them. Teammates need to filter, segment, ask their own follow-up questions, and build on the work, with the right access for the right people.
And from what we hear from our customers, we weren’t alone in those struggles.
New today: Open your Claude Dashboards in Mixpanel
Today, we're excited to be partnering with Anthropic to bring you a new capability that makes this workflow much better. Anthropic today launched Claude Dashboards, in beta on paid plans. This new artifact type in Claude lets you go from raw data to a dashboard, all without leaving your agentic workflow. And the best part? If you want to push that dashboard back into Mixpanel, you can.
But why would you? While there’s a lot you can do just sticking in Claude and using our MCP server, there are times when you need to dig deeper:
- Interactive "why" diagnostics: Once the initial charts are built, you can instantly break down, segment, and filter the data on the fly. You can dive from a high-level board straight into deep retention reports, or click an exact funnel drop-off point to watch the matching Session Replays alongside AI summaries.
- A live, persistent workspace: It moves the data into a shared environment where metrics update automatically. Any layout tweak, precise UI adjustment, or inline comment shows up instantly for your entire team, keeping everyone aligned on the exact same view without anyone needing to open a separate view.
- Full governance and visibility: It layers in enterprise-grade data verification by letting you inspect the exact query logic, metric definitions, and raw event schemas behind every visual. A polished UI lets you verify definitions and manage secure role-based access control (RBAC) instantly, without having to prompt a model to see how a metric was calculated.
See it in action
Say a growth PM is using Claude to brainstorm ideas for updating a new onboarding checklist to improve user retention. She uses natural language to ask Claude for a dashboard showing how the checklist is affecting activation for users who signed up in the last 30 days. In a few minutes, she has a draft: signups, checklist completion, and activation rate, broken out by platform.
The funnel in the dashboard shows mobile users dropping off at step three. To dig in, she opens the dashboard in Mixpanel, clicks into that step, watches a handful of Session Replays, and sees the button for that task sits below the fold on smaller screens. She shares the board with her designer and engineer, and the three of them decide to test a fix. The dashboard that started as a quick prototype is now where the team tracks the results.
What's next
This is a first step, and we're continuing to innovate and invest here to unlock new workflows for our customers. Here are some things coming next.
- Open in Claude: Today the path runs from Claude to Mixpanel. We're building the way back: a button on any board that copies a ready-made prompt, with the right IDs and instructions included. Paste it into Claude, and Claude rebuilds the board so you can keep iterating in conversation wherever you like to work.
- Custom dashboards, built natively in Mixpanel: Claude artifacts give you a lot of creative control over layout, color, and storytelling. Today, native boards carry over your data and charts, but not all of that visual personality. We're building ways to bring more of those elements into Mixpanel, so a dashboard that looks and feels like yours can also run on governed, shareable, drill-down-ready data.
- Verified data: When you open a Claude dashboard in Mixpanel, we'll flag which metrics match your team’s verified definitions, so you know what’s ready to share.
Excited about any of these? Something else you’d like to see? Tell us what you think. Log in to Mixpanel and find the Submit Feedback button at the bottom of your Home screen.
Try the workflow
- Start with a question. Use Mixpanel's MCP server in Claude to prototype a dashboard around what you're trying to learn.
- Open it in Mixpanel. One click turns your prototype into a board built on your governed Mixpanel data.
- Iterate together in Mixpanel. Share it with your team, dig into replays and experiments, and refine it as your questions evolve.
How to get access
Already a Mixpanel customer? Claude Dashboards is in beta on Claude paid plans. On Enterprise plans, an admin needs to turn it on first. You’ll also need to be connected to Mixpanel's MCP server. Build your dashboard, then open Share, go to Export, and choose Mixpanel. If you haven’t connected Mixpanel to Claude yet, you’ll connect it first. Claude then creates the board in Mixpanel from your conversation.
New to Mixpanel? Create a free account and connect Mixpanel to Claude through the MCP server.
Give it a try and let us know what you think. Log in to Mixpanel and find the Submit Feedback button at the bottom of your Home screen.
Analytics for everyone.
Product @ Mixpanel