Every week a new OCR model is state of the art on some benchmark, often one that its own builder made and scored. So everyone is #1, and a headline score alone won’t tell you which parser to use.
I gave a talk on this at the AI Evals for Engineers & PMs course last month (video). This post is the written version, with more detail than fits in 25 minutes. It covers three things:
- How to tell what a benchmark score means, and the checks that catch a bad one.
- Which metrics work for OCR, which ones break, and why.
- A step-by-step eval on your own documents, using a real run we did on annual reports.
One disclosure up front. We build OCR models and sell a document parser, and we built one of the benchmarks in this post, OmniParseBench. Hold us to the same checks as everyone else.
Parse errors reach your app
If your app reads documents, the first step in every trace is the parse. A PDF or a scan goes in, text comes out, and everything after that (chunking, retrieval, extraction, the LLM’s answer) trusts that text. When the parse is wrong, the error usually shows up later, as what looks like an LLM mistake.
Three real parse errors, all from the eval at the end of this post:
- A 3 read as an 8. A parser read $3,915.00 as $8,915.00. Every later step trusted the 8. In a KYC or finance workflow, every result built on that number is wrong.
- The right word in the wrong alphabet. A parser wrote the row label “BHE” in Cyrillic letters. It looks identical on screen. A search for “BHE” never finds the row. We wrote about this failure in script confusions.
- Padded tables. A markdown table padded with spaces put a table’s header in one chunk and its total in another. Switching the same parser to compact tables took it from 71 to 80 correct answers out of 81.
So when you do error analysis on a trace, open the parse output. Many “LLM errors” start there.
To fix them, you need to pick a parser, and most people start with a benchmark.
A score means nothing until you know what it measures
On ParseBench, LlamaIndex’s parsing benchmark, we took Surya, our 650M-parameter OCR model, from 23rd to 3rd of 148 systems, ranked on its four non-chart dimensions. We ran 70 steps of reinforcement learning on formatting, plus a few inference fixes. We didn’t train on any ParseBench documents. Surya read the pages as well as before, and its output matched the benchmark’s formatting more closely. We released the checkpoint so you can check this yourself, and the full story is here.
On ExtractBench, LlamaIndex’s extraction benchmark, our score went from 64.5% to 93.6% with no change to the extracted values. Its adapter counted our confidence and citation metadata as wrong values. We fixed that and used neutral number matching.
In both cases the reading didn’t get better, and the result moved a lot: 20 places on ParseBench, 29 points on ExtractBench. Launch posts cite benchmarks like these, and people pick parsers from them.
Three benchmarks, three orders
Fig. 1 shows six open OCR models on ParseBench and OmniParseBench:
Nemotron 3.5 Parse is first on ParseBench and last on OmniParseBench. dots.mocr is last on ParseBench and second on OmniParseBench. On olmOCR-bench, AllenAI’s benchmark, five of the six score between 83.3 and 87.6 as each vendor reports it, each with its own cleanup, which is too close to rank. Nemotron doesn’t report it.
Settings differ too: on ParseBench, Nemotron runs a three-pass pipeline, and on OmniParseBench it runs its vendor client’s default single pass. But the main cause is that the benchmarks measure different things, and some of those things aren’t reading.
Same pages, different metric
OmniParseBench includes 81 of ParseBench’s own pages, scored with our own tests. On those 293 tests, the order changes again: LightOnOCR-3-4B and Infinity-Parser2-Pro 91.8, Chandra OCR 2 90.4, dots.mocr 84.6, Surya OCR 2 81.6, Nemotron 3.5 Parse 81.2. The slice is small, so don’t read gaps under about 3 points. But Nemotron goes from first to last on the same pages.
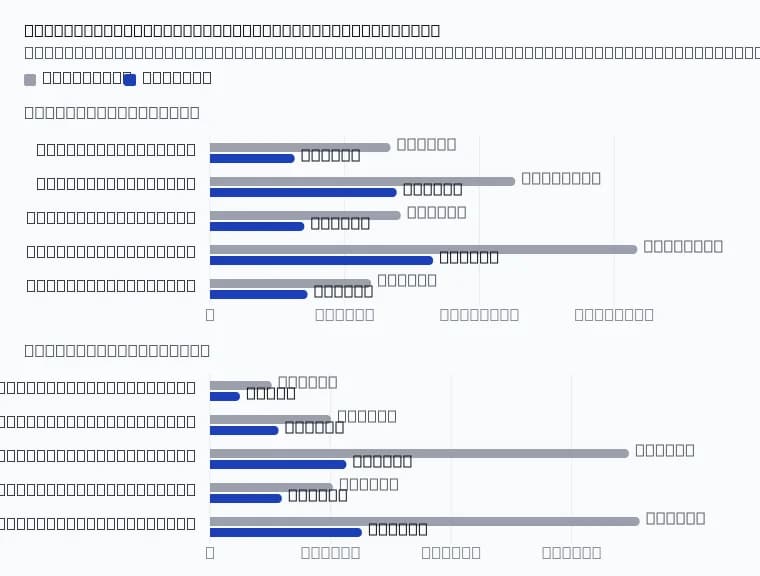
Charts explain most of it. A ParseBench chart rule asks for a value read off a bar or a line, and checks it against a number in its ground truth:
The bar on the page is 303 GW. The rule wants 310, within 1%. A model that reads the chart correctly fails. 73% of ParseBench’s chart rules (3,569 of 4,864) are values the chart doesn’t print, so the “ground truth” is itself a model’s estimate. There’s also no single right way to write a chart as a table, so a parser that names a series differently fails too.
dots.mocr isn’t trained to convert charts to tables, so it scores 0.95 out of 100 on these rules. An OmniParseBench test on a chart page checks only text that’s printed on it, like the axis labels here, and dots.mocr passes 92.7% of those:
Ground truth made by a model also favors that model. If you label pages with your own model, your model makes the same choices as the labels, and everyone else gets marked wrong for reading the page a different, equally valid way.
What makes a metric good
A good metric has four properties, and each one comes with a test you can run yourself.
Validity sounds too obvious to list, but many benchmarks don’t meet it, as the next section shows. Specific favors simple metrics: if a test fails, you need to know why, and a simple metric tells you. Sourced means you can tell someone why the answer is right, and “a model told me” isn’t an answer. Discriminating means some systems pass and some fail. A metric everyone passes, or everyone fails, tells you nothing.
Metrics that break
Edit distance
Edit distance compares the whole output with one reference text and counts the characters that were added, removed or changed. It sounds like exactly what you want: if the output differs from the ground truth, it’s wrong. OmniDocBench, a popular parsing benchmark, uses it to score text.
Take a reference table and two outputs:
0 means identical. Output A is completely correct and scores as mostly wrong, because HTML and markdown differ in almost every character. Output B has a wrong revenue figure and scores as almost perfect. The format change costs 48 times more than the wrong number. For a finance pipeline, B is the dangerous one. (These are plain Levenshtein distances divided by the longer length.)
Edit distance over-penalizes formatting and under-penalizes the content errors that hurt you. Some models write markdown and some write HTML, so on an edit-distance benchmark, part of the score measures which format a model happens to output. We measured this across 13 parsing benchmarks in which parsing benchmarks to trust: on the edit-distance benchmarks, making 5% of the digits wrong costs only 0.1 to 0.4 points out of 100.
Layout and table metrics
Layout and table metrics also punish a valid answer written in a different form.
Layout metrics like IoU and mAP compare the boxes a model draws around blocks with the boxes in the ground truth. But everyone draws layout slightly differently. Say the ground truth has one box per paragraph, and a model draws one box around two paragraphs. That’s a reasonable reading of the page. Its overlap with each ground-truth box is below 0.5 IoU, so both count as misses. A benchmark that scores layout this way mostly measures whether you segment the page the same way its builder did. When we built OmniParseBench, we found a way to match blocks that doesn’t punish a different but valid segmentation.
Table metrics like TEDS and GriTS compare table structure as HTML. If the scorer can’t parse your format, a correct table scores zero. ParseBench’s table scorer reads only HTML. Its own harness converts markdown tables first, but a correct markdown table that skips that step gets 0.
LLM judges
Using an LLM as the judge is tempting. It’s fast, and it handles every format. But you have to check it, because a judge has its own biases and gives you no fixed answer to audit.
In a real case from the eval later in this post, the judge prompt said “NOT FOUND” is always wrong. The gold answer was a number from the page. The model answered NOT FOUND, and the judge (gpt-4.1) marked it correct. This happened 16 to 19 times per run. We replaced the judge with an exact number match.
Judges also change from run to run, and you can’t build a stable eval on a moving metric. Use one only for narrow, well-checked tasks, or for a quick feel across many pages.
Unit tests work, until a test is wrong
The method that works best for OCR is the unit test, which AllenAI introduced with olmOCR-bench. Each test is a yes/no question about one page. Three real olmOCR-bench tests:
- A present test: is the sentence “I soaked the water up with a cloth.” in the output?
- An order test: on a two-column page, does reference “48: 105-9.” come before “TGF-beta signaling: positive and negative…“?
- A table test: is the cell “0.569” in the row headed “BO”?
A failure points to one mistake you can go and look at, which is the “specific” property. Unit tests also mostly don’t care how you format the output, only whether the content is right. In my opinion, this is the best way to benchmark OCR. But a unit test is only as good as each test.
When “correct” is ambiguous
Almost every test is ambiguous in some way, and your job as the person building the eval is to clear that up. These two olmOCR-bench tests fail a correct transcription:
The test wants the officers’ names on one line, but the page puts a line break there. Most models keep the line break, so a model that copies the page faithfully fails this test.
The test has a capital P, and the page has a small p. The test is case-sensitive, so there’s no way to pass it with a correct transcription.
Two more, each on its own page:
- A math test stores one LaTeX string, r-s=2,4 \text{ mod 4}. A model that writes \text{ mod } 4 renders exactly the same equation, and fails. LaTeX can write the same equation many ways, and the tests mostly compare strings.
- An absent test says a footnote on a Swedish statute must not appear in the output. But the footnote cites the statute’s legal source, so a careful parser keeps it, and fails.
These are opinions written as tests. When we had a model re-check every olmOCR-bench test that Chandra failed, its score went from 85.5% to 93.9%, and most of the failures were nitpicks like these. About 3% to 4% of the tests are wrong or too opinionated, so the real ceiling is about 96% to 97%. We wrote this up in saturating the olmOCR benchmark.
You find these by reading your tests and your data closely.
When good tests miss your documents
Even when every test is right, a benchmark can miss your documents. olmOCR-bench is mostly English arXiv papers and old scans. It has no forms, its table tests only check a cell’s next neighbors, and it has almost no non-Latin script. If your documents are forms or Japanese invoices, it can’t tell you much.
It’s also saturated. Five models now score between 83.3 and 87.6, and new releases report scores after increasingly elaborate postprocessing written for the benchmark:
A postprocessor of about 700 lines adds 1 to 2 points, which is more than most of the gaps between models. It rewrites the output into the form the tests expect, and the model itself stays the same. At some point, a saturated benchmark stops measuring quality and starts measuring how well you can fit it. This happens to every benchmark eventually, AllenAI’s included.
Slice by what your pipeline needs
What counts as correct depends on what you do next with the text:
So one benchmark number can’t tell you which model is best for you. A benchmark you can slice by category can. The best of the same six models changes from one OmniParseBench category to the next:
Pick the categories that match your documents, and score only what your pipeline needs.
Four checks you can run on any metric
You’d run the same checks on an LLM judge, where a known-good output must pass and a known-bad one must fail.
- Swap the format. Score the same correct output as markdown and as HTML. A good metric gives the same score. Edit distance calls a correct HTML table 77% different from the same table in markdown, so it fails this check.
- Corrupt a correct output. Change a digit, a row label or a year, or switch the case. The score must drop. In our eval below, we made 143 copies of table tests with a wrong row label or year, and 0 of 143 passed, which is what you want.
- Read the shared failures. Look at the tests that every strong system fails. When all of them disagree with the ground truth, the ground truth is usually wrong. In our eval, 45 of our first 192 tests failed on every strong parser, and the tests were the problem.
- Look for bias. Does the benchmark favor one family of models? On ParseBench, LlamaParse’s cheapest tier trails the best other system on four of five dimensions, and leads by 3.16 points only on Visual Grounding, whose labels follow LlamaParse output. More on that next.
A case study: ParseBench
ParseBench shows how a benchmark fails these checks. I’m not trying to pick on LlamaIndex here. Other benchmarks have problems too, but other vendors now cite ParseBench in their launches, so we looked at it closely. Why we built OmniParseBench has the full analysis.
One unlike score decides the rank
ParseBench’s headline is the plain mean of five dimensions, each with its own metric:
dots.mocr wins Tables and Content, the dimensions that measure reading, and still trails by 19.4 points overall. Charts alone causes 12.7 of those points, and 73% of the chart rules are estimates.
It rewards formatting more than reading
There are at least three ways to gain on ParseBench without reading any better:
- A prompt. Pulse, another document-processing company, changed its prompts and configuration to match the rubric and went from 51 to 74 on Semantic Formatting in its own re-run. That update moved it from 7th to 3rd.
- Output options. Turning on documented output options in our API moved our Semantic Formatting score from 46 to 77, with the same text.
- RL on formatting. Surya went from 23rd to 3rd, as above.
Some of the formatting rules fail a correct transcription outright. One wants “Parish Priest:” in bold, but the page sets it in a regular weight. One wants “ZIA TRUST, INC.” as a bold title, but the page sets it in the body font at body size. And a superscript written with spaces inside the tag, <sup> 2 </sup>, never matches, so all 318 superscript rules score 0.00.
The ground truth follows one vendor
LlamaParse’s cheapest tier minus the best other system, per dimension:
The Visual Grounding boxes come from “normalized parse output”, mapped with a function named map_llamaparse_raw_label_to_canonical. An open layout model matched only 68% of the text boxes and 39% of the section titles at IoU 0.8, on 273 pages. A cheap tier that loses on every other dimension and wins only here is what you’d expect if the ground truth follows its conventions.
It has scoring bugs
We found 11 scoring bugs. Four of them:
Benchmarks are often built in a rush, and scoring bugs this large are a sign that nobody sanity-checked the results.
Benchmarks have different goals
Not every benchmark tries to do the same thing. Some are built to be fair and mostly are, like olmOCR-bench: careful unit tests, checked by people. Some are built to be fair and have flaws, like ExtractBench, where a scoring bug counted correct values as wrong. Some are tilted toward one family of models, like ParseBench, whose rubric and grounding labels follow LlamaParse output.
So ask of any benchmark: what was it built to show? This smell test takes about five minutes:
- Who built it, and do they rank first?
- Does a format-only change move the score?
- Does each test record where its answer came from?
- Can you reproduce the published numbers?
- Did any vendor get a custom prompt?
- Is there headroom, or is the top at 99%?
- Can you slice it to your document types?
How we built OmniParseBench to pass these checks
We built OmniParseBench, and we sell a parser, so we hold it to a higher bar than the others. Every page, test and adapter is public, so you can check it yourself. Every test follows four rules:
- The claim is visibly true of the page.
- A correct transcription passes.
- A wrong transcription fails.
- If a test can’t be shown to be right, drop it.
Every test says where its answer came from
It has 16,288 tests on 2,937 pages. Each test records where its answer came from. The largest sources:
None of the six models in this post helped make a test. Two frontier models that helped make or verify some tests are marked on the leaderboard. We also removed 18,264 trivial tests, ones that every system passed, that a plain tool with no model also passed and that a judge model rated trivial, so the benchmark has headroom. Three examples, each with its source:
None of these answers came from a model, which is the “sourced” property from earlier.
Format doesn’t matter
HTML or markdown, pretty-printed or not, $…$ or <math>: every output goes through the same converter and the same normalization, on both sides of every comparison. Equations are compared by how KaTeX renders them, not by the LaTeX string. Numbers must match digit for digit, but thousands separators don’t count, so 1,240 equals 1240.
Same rules for everyone, and you can slice it
No vendor gets a custom prompt. Every system gets the same timeout and retries. The headline is the mean of three families (text, tables and layout), so adding more tests of one kind doesn’t tilt it. And every test carries tags, so you can score only what you care about: 92 languages, handwriting, tables, forms. There’s headroom: on handwriting, the best parser on the launch leaderboard scores 81.4% and the median 72.2%.
Build your own eval: a worked example
No public benchmark covers your documents and your pipeline exactly. The only reliable way to choose is to build a small eval of your own. The recipe has eight steps:
- Define the task and what a failure costs.
- Segment your documents.
- Write questions you can verify.
- Pick one metric per failure that costs you.
- Design and check each test.
- Run every candidate, testing reading and retrieval separately.
- Read the failures.
- Check the eval itself for bugs.
We ran this for real, to choose a parser for RAG over annual filings. There were two runs: 28 filing pages with 81 questions, and 25 harder scans with 95 questions. We compared four ways to get text from the pages (the PDF text layer, Datalab, Mistral OCR and Reducto) through one RAG pipeline. It’s a worked example, and it’s far too small to rank vendors.
Step 1: define the task and what a failure costs
The task is to answer numeric questions from 10-K and annual-report pages. Here, a confident wrong number costs more than “not found”, because someone may act on it. Write that down before you pick any documents, because it decides what you measure.
Step 2: segment your documents, then sample each segment
Segment by whatever changes difficulty, then sample a few pages from every segment. Report a score per segment.
Take 20 to 50 pages, and cover every segment you see in production. If your volume grows, resample at intervals to build a bigger set over time.
Score each segment on its own, because averages hide failures. The free PDF text layer gets 63 of 81 questions right, which sounds fine. By segment, it gets 63 of 63 on born-digital pages and 0 of 18 on scans, because scans have no text layer. If your traffic has scans, the average misleads you. (Our scans here are simulated. The harder run below uses real ones.)
Step 3: write questions with answers you can verify
Each question has a gold answer you can check:
- The answer is visible on the page image.
- The answer string is also in the source text. A script found all 81 of 81, which catches typos in your own gold answers.
- There are 2 to 6 questions per page, from every segment.
- Most answers are numbers (70 of 81), and some are text (11).
One real question: “For Apple’s share repurchases in the quarter ended September 28, 2024, what approximate dollar value of shares (in millions) may yet be purchased?” The gold answer is $89,074 million, from the Total row of the repurchase table in Apple’s FY2024 10-K. Keep this one in mind, because one setup gets it wrong later, and the cause isn’t OCR.
On scans with no text layer, check the gold answer with the page’s own arithmetic wherever you can:
Q: How many tons of revenue freight were carried one mile in 1903? Gold: 3,721,877,190. Check: 3,721,877,190 + 534,777,562 = 4,256,654,752, the printed total, so the first digit is a 3. One parser read it as 8,721,877,190.
Step 4: pick one metric per failure that costs you
Each failure that costs money in this task gets a test that catches it:
The last row is the most useful. Asking each question with only the page that holds the answer, with no retrieval, separates reading errors from chunking errors. Without it, we’d have blamed the parsers for what the chunker did.
Step 5: design and check each test
Each test must pass a correct answer and fail a wrong one, so test your tests:
- Negative controls. We made 143 copies of table tests with a wrong row label or year. None of the 143 passed, so we know the tests can fail.
- Format. 45 of our first 192 tests failed on ”$” in a cell, two-row headers and footnote marks like “Services (1)“. Every strong parser failed them. The parsers were right, and we fixed the tests.
- Normalization. Normalize what doesn’t matter for your task, on both sides of the comparison. Row labels compare without spaces, and dash types match, so “0.000% – 4.850%” equals “0.000% -4.850%“.
Step 6: test reading and retrieval separately
Every question is asked twice. In the reading arm, the model gets only the parsed page that holds the answer, so it measures reading. In the RAG arm, the model gets the top 5 chunks retrieved from all 28 pages, so it measures retrieval too.
RAG runs are the median of 3. All three OCR parsers read every page correctly: 81 of 81. With a plain 1,000-character chunker, Datalab and Mistral get 80, and Reducto gets 70, because its HTML tables split headers from their rows. With a table-aware chunker, all three get 77 or 78, a tie at this sample size. The text layer gets 63, because 8 pages are scans with no text layer.
A real system searches far more than 28 pages, so retrieval only gets harder. But this small corpus is enough to show where the parse output hurts retrieval.
Back to step 2: harder pages
The clean filings didn’t separate the parsers, which is a sign your documents aren’t hard enough. So we went back to step 2 and added a harder segment: 25 real Internet Archive scans of old Canadian annual reports, from 1903 to 1983, with 95 questions. We checked each answer by eye, and most by the totals printed on the page.
Now reading differs. The text layer gets 0, because these are image-only scans. By segment: on the 10 clean scans from 1950 to 1983, every parser gets 54 of 54. On the 1903 letterpress pages, Reducto gets 31 of 48, and the others get 45 or 46. Wide landscape tables break the plain chunker for everyone.
Read this table with care. We picked 15 of the 25 pages because the parsers disagreed on them, mostly Reducto, so these gaps are larger than you’d see on typical pages. We also sell one of these parsers. The table shows that harder pages separate parsers, and the sample is too small and too selected to rank them.
Step 7: read each failure and find its cause
This is error analysis. Read the failures, write down what went wrong, and group them. Three examples, each with a different fix:
- A header split from its value. Remember the Apple question. With a plain chunker, a padded markdown table put the header and the total in different chunks. The model then did its own arithmetic and answered “about $89,100M”, a plausible wrong number. The fix was an output option: compact tables.
- An invisible character error. Reducto wrote the row label “BHE” in Cyrillic letters. It looks identical, but a search for “BHE” misses it. The BHE question failed in all 6 RAG runs.
The fixes are the chunker, a text check and a parser that reads the digits, and a score alone wouldn’t tell you which one you need.