Lighthouse is an open source tool from Google that helps frontend teams assess the performance, accessibility, and overall quality of their web pages. But tracking page health over time often requires running audits manually in Chrome DevTools, adding Lighthouse to a CI pipeline, or maintaining a separate service. Even when teams automate audits, the results typically live outside their monitoring platform, disconnected from the performance data collected from real users. When page performance degrades, engineers must compare different sources to determine whether the regression affects the page broadly or only specific users.
Datadog brings Lighthouse audits into Synthetic Monitoring and Real User Monitoring (RUM), enabling you to collect Lighthouse scores automatically and investigate them alongside real-user Core Web Vitals. You can identify regressions, investigate potential causes, and measure the impact of optimizations without maintaining a separate Lighthouse monitoring workflow.
In this post, we’ll show how you can:
- Run scheduled Lighthouse audits from your Synthetic browser tests
Run scheduled Lighthouse audits from your Synthetic browser tests
- Compare lab and field data view by view in RUM
Compare lab and field data view by view in RUM
- Track and alert on Lighthouse scores over time
Track and alert on Lighthouse scores over time
Run scheduled Lighthouse audits from your Synthetic browser tests
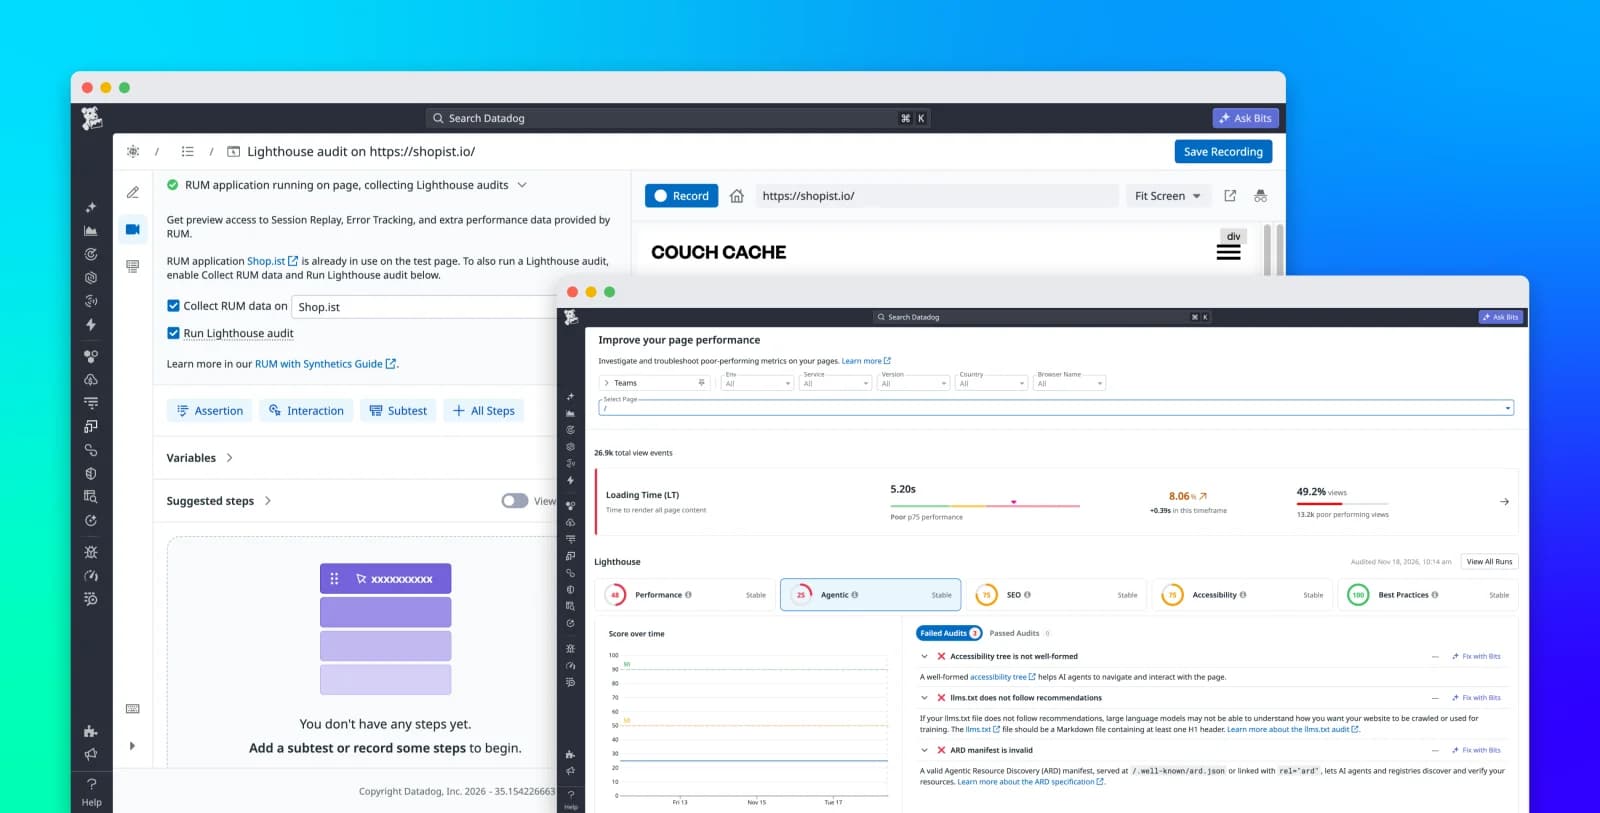
A Lighthouse report captures how a page performs under a set of test conditions. With Datadog Synthetic Monitoring, you can enable Lighthouse audits on existing browser tests and run them automatically on the tests’ regular schedules. There’s no need to create a separate test type or maintain an additional tool. Each audit evaluates the page where the browser test ends and sends its results to RUM, providing a consistent series of measurements to compare across releases.
Lighthouse audits run in a separate, clean browser tab while retaining the browser test’s session. This approach is particularly useful for testing pages that require authentication. For example, a Synthetic browser test can log in to an ecommerce application, navigate to an account dashboard, and run a Lighthouse audit on the authenticated page. You can therefore include pages such as account dashboards and checkout flows in your scheduled assessments instead of limiting audits to publicly accessible URLs.
Review Lighthouse scores, metrics, and audit findings
Each Lighthouse audit provides five category scores that help engineers assess aspects of page quality:
- Performance: Evaluates page loading and responsiveness
Performance: Evaluates page loading and responsiveness
- Accessibility: Identifies issues that might make a page difficult to use for people with disabilities
Accessibility: Identifies issues that might make a page difficult to use for people with disabilities
- Best Practices: Checks for common web development issues that can affect page quality
Best Practices: Checks for common web development issues that can affect page quality
- SEO: Evaluates whether a page follows practices that help search engines understand its content
SEO: Evaluates whether a page follows practices that help search engines understand its content
- Agentic: Evaluates how well AI agents can understand, navigate, and interact with a page
Agentic: Evaluates how well AI agents can understand, navigate, and interact with a page
Lighthouse also captures lab performance metrics, including First Contentful Paint (FCP), Largest Contentful Paint (LCP), Total Blocking Time (TBT), Cumulative Layout Shift (CLS), and Speed Index. These measurements help you understand which aspects of page loading, responsiveness, or visual stability need attention.
Beyond the scores and metrics, Lighthouse identifies individual audits that a page fails, grouped by category. For example, a report might flag render-blocking resources or images that lack explicit dimensions.
Compare lab and field data view by view in RUM
Lighthouse lab data and RUM field data provide complementary perspectives on application performance. Lab data measures how a page behaves under controlled conditions, so it’s useful for detecting changes introduced by code or page resources. Field data captures what actual users experience across different devices, browsers, and network conditions. Comparing the two helps you distinguish page-level regressions from performance problems that affect particular user segments.
Identify pages that need attention
The Datadog RUM Summary page includes a Lighthouse tab that lists audited views and their scores across the five Lighthouse categories. Views are sorted by their performance scores, with the lowest-scoring pages appearing first. You can identify pages that might need investigation without opening individual Lighthouse reports.
Investigate performance regressions with lab and field metrics
On the Investigate > Vitals page in RUM, Datadog displays real-user Core Web Vitals alongside a Lighthouse panel that contains the latest audit results for the selected view. You can use this information to compare the experience reported by actual users with measurements collected under controlled conditions.
The Lighthouse panel includes a gauge for each category score and lab metrics rated Good, Needs improvement, or Poor. It also displays the number of passed audits and failed audits. You can select the failed audit count to inspect individual findings and their explanations. For further investigation, the panel provides access to the Synthetic test result that generated the audit. You can also open the full Lighthouse report or download the raw results as JSON.
Consider a checkout page whose real-user LCP increases from 2.2 seconds to 3.6 seconds after a release. The increase indicates that users are waiting longer for the page’s largest content element to render, but the field data alone might not explain why.
When you open the checkout view in RUM, you find that the Lighthouse performance score also dropped from 92 to 71 during the same period. The latest Lighthouse report includes a failing audit for an oversized hero image. Because both the controlled lab measurements and real-user LCP deteriorated, the evidence points toward a page-level regression rather than an issue limited to specific devices or network conditions.
Now consider a different scenario: Real-user LCP increases, but Lighthouse performance scores remain stable. The controlled test does not reproduce the slowdown in this case, suggesting that the problem might affect only a subset of users (for example, users in a particular geographic region or with older devices). You can use RUM to break down real-user performance by the relevant dimensions and investigate where the degradation is concentrated.
Start auditing additional views from RUM
You can also create Lighthouse-enabled Synthetic browser tests directly from RUM. If a view has not been audited, the Lighthouse panel provides a “Create a Synthetics test” option. Selecting this option opens the browser test editor with a URL of the selected view, the associated RUM application, and Lighthouse auditing already configured. You can review the test, choose a schedule, and save it to begin collecting audit results. This workflow helps you extend Lighthouse coverage to important application pages as you identify them in RUM, without you having to configure each test from scratch.
Track and alert on Lighthouse scores over time
Datadog tracks Lighthouse scores over time so that teams can evaluate page health beyond individual audit results. The Lighthouse panel in RUM shows how each category score changed compared with the previous time frame and charts all five scores historically. These trends help you investigate whether a release, third-party script, or frontend optimization contributed to a change in page quality.
Lighthouse category scores are also available as out-of-the-box RUM metrics for individual views. You can break down these metrics by application, environment, service, or release version and use them throughout Datadog.
Correlate page health with real-user and business metrics
Datadog dashboards enable teams to graph Lighthouse scores alongside other metrics that describe application performance and user behavior. For example, a web team can display the Lighthouse performance score for its home page alongside real-user LCP and conversion rate. If the performance score declines while LCP increases and conversion rate decreases, the combined trends give the team additional context for investigating whether frontend performance is contributing to a business impact.
Detect regressions with monitors and SLOs
You can incorporate Lighthouse scores into Datadog monitors and service level objectives (SLOs) to track page quality as part of your existing monitoring workflows. For example, you can configure a monitor to alert when the Lighthouse accessibility score of your sign-up page falls below 90.
You can also define SLOs to measure page quality against targets and assess whether releases maintain the expected level of performance, accessibility, or other Lighthouse categories. Because the scores can be broken down by release version, you can compare page health across deployments.
Get started with Lighthouse audits in Datadog
Lighthouse audits in Datadog Synthetic Monitoring and RUM help frontend teams track page quality over time and investigate performance regressions alongside real-user experience. By bringing scheduled lab measurements, audit findings, and field data into the same monitoring platform, teams can identify potential causes of regressions and measure the impact of frontend changes.
Lighthouse audits are available to customers who use both Datadog Synthetic Monitoring and RUM. To get started, see the Synthetic browser tests documentation and the RUM browser performance optimization documentation.
If you don’t have a Datadog account, you can sign up for a 14-day free trial to start monitoring frontend performance with Datadog.