If your organization runs much of its infrastructure on Microsoft Azure, your teams might use Azure Data Explorer (ADX) for exploratory analytics on large datasets. In ADX, you can write Kusto Query Language (KQL) queries to hunt for threats and join logs with business data you already store in Azure. But ADX is only as useful as the logs you put into it. Logs arrive from dozens of sources in different formats. You need to parse, clean, and map each source’s logs to the right table before you can query them efficiently. That work usually lives in custom ingestion scripts that you have to maintain. Noisy or unparsed logs can also cost you twice: once to ingest and store them, and again each time you write KQL to clean them up. Beyond cost, unredacted logs can expose sensitive data to users with access to the ADX table.
Datadog Observability Pipelines now integrates with ADX, so you can collect, process, and route logs to ADX and rely less on custom ingestion scripts. With this integration, you centralize log processing within your own infrastructure, redact sensitive data, and send ADX only the logs your teams need. To monitor, troubleshoot, and alert on the same logs in real time, add Datadog Log Management as another destination.
In this post, we’ll cover how Observability Pipelines helps you:
- Process and route logs before they reach ADX
Process and route logs before they reach ADX
- Add ADX alongside your current platform and keep full-fidelity archives
Add ADX alongside your current platform and keep full-fidelity archives
Process and route logs before they reach ADX
With Observability Pipelines, you can use processors to parse, filter, and transform logs in your own infrastructure before sending them to ADX. The Table and Mapping Reference fields in the ADX destination support template syntax, so you can route logs to different tables based on an attribute you set. For example, add the attribute adx_table: "network_logs" to firewall logs and adx_table: "identity_logs" to authentication logs, then set the destination’s table field to {{adx_table}}.
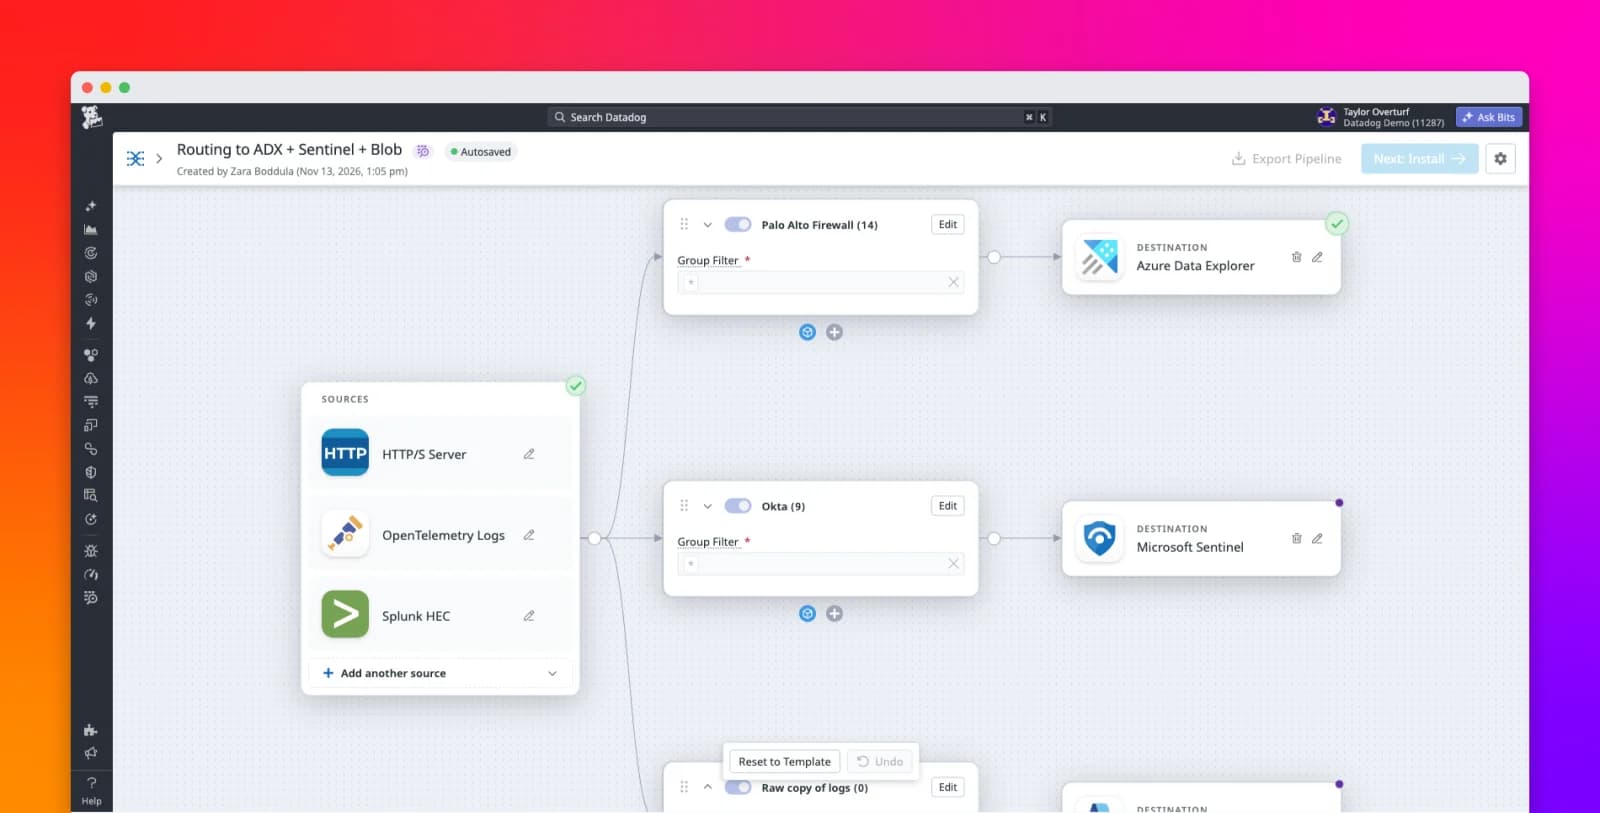
If you’re a platform engineer at a large financial services company, your security team might want Palo Alto Networks firewall and Okta logs in Microsoft Sentinel for detection. Observability Pipelines can process both log types in one pipeline and route each to its own destination. To meet your security team’s needs, start by parsing each log type with the Grok Parser processor, which supports library and custom rules. Next, add the Sensitive Data Scanner processor to redact account numbers and the Filter processor to drop health checks. Before you deploy the pipeline, use Pipeline Simulation to confirm that logs exit the Edit Fields processor with the expected adx_table value. After you deploy it, run Live Capture on the same processor to check the logs it sends.
When you configure the ADX destination, select the authentication and ingestion options that fit your Azure environment. Observability Pipelines supports authentication through Microsoft Entra ID, including managed identities and workload identities for Azure Kubernetes Service (AKS). For ingestion, choose streaming ingestion when you need logs available to query quickly, or queued ingestion for high-throughput batches.
Add ADX alongside your current platform and keep full-fidelity archives
ADX is rarely your only log destination. The same logs often need to reach Datadog for real-time monitoring, a SIEM such as Microsoft Sentinel or Splunk for detection, and cloud storage for long-term retention. Adding ADX to that mix usually means reconfiguring every source and then checking that the new platform receives the right logs in the right format. Observability Pipelines reduces that work. You configure your sources once to send logs to the Observability Pipelines Worker, and the Worker routes them to each destination.
Say your security team wants to add ADX for long-term threat hunting alongside Splunk. You can configure Observability Pipelines to dual ship the same logs to both platforms, then query both to confirm that ADX receives the expected logs with the correct fields and values. When your needs change, you update the pipeline’s destinations instead of reconfiguring each source. Observability Pipelines also supports Datadog, Microsoft Sentinel, Google SecOps, Azure Storage, andother destinations.
Observability Pipelines provides monitors and a dashboard that help you identify pipeline-health issues while you validate the new destination. During dual shipping, you canenable out-of-the-box monitors for suggested use cases and customize them to track potential issues. When a monitor flags a problem, open the Observability Pipelines Overview dashboard and filter by pipeline, Worker, or component to narrow down where the problem occurs.
To retain unfiltered logs, add another set of processors and destinations that archives them in Azure Storage while the pipeline sends a filtered subset to ADX. The archive keeps full-fidelity logs available for future investigations, and you control what reaches your analytics platform. If you need those logs later, you canrehydrate them into Datadog.
Get started with Datadog Observability Pipelines
Datadog Observability Pipelines helps you send query-ready logs to ADX by filtering logs and redacting sensitive data in your own infrastructure before the logs leave your environment. The same pipeline also supports gradual migrations and archives logs for future investigations.
To get started, set up the ADX destination in a new logs pipeline or an existing pipeline, and add theprocessors your teams need.
If you’re not already a Datadog customer, sign up for a free 14-day trial.