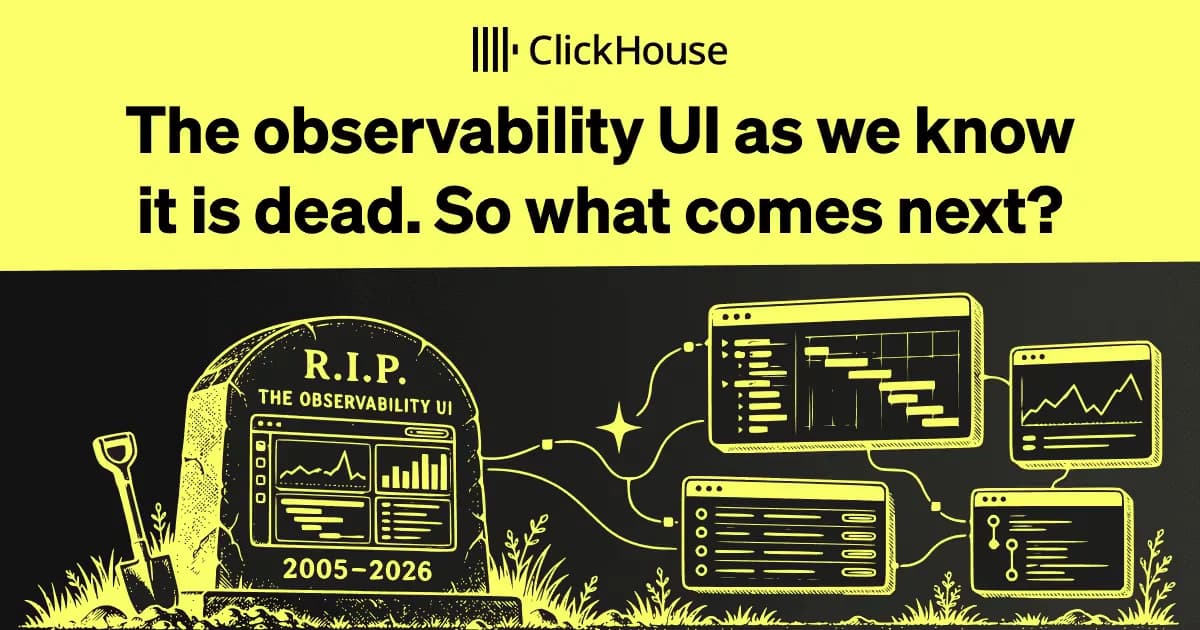
The happiest observability users we meet are almost invariably those who have built their own UI. As we've been building ClickStack and trying to work out which features to prioritize, that's been a recurring theme.
Core workflows cover some needs well. But there's always a long tail of requests for experiences that fit a particular business, team, or way of investigating. Supporting those needs without making the product more complicated for everyone else is a familiar product design tension that will resonate with PMs.
Generating observability applications with AI may offer a way out of this dilemma, though. Users could shape the experience around their questions, rather than reshaping their questions to fit the available screens.
We built ClickHouse Observability Apps to give every user their own experience, without needing the resources to build an observability UI from scratch. These are interactive applications over live data, with connected screens, custom visualizations, and workflows that go beyond dashboards. They reuse our investigation APIs and core components, bringing established query logic and consistent behavior into the experiences teams create.
Over the last few years, we’ve seen companies like Anthropic, DoorDash, Tesla, and Netflix build their own observability experiences on top of ClickHouse. They shape their experiences around their systems, their teams, and the questions they need to answer. If a workflow is missing, they just build it. Trying to convince these teams to use a vendor UI is like asking a Vim user to switch editors because yours has nicer menus.
Not every company has the resources to build its own observability UI, but each needs an experience that reflects its systems, business processes, and critical customer journeys. Within the company, that experience also needs to fit the people using it. A payments engineer might start with a processor's success rate, a support agent with a customer's incomplete order, and an infrastructure team with the services behind checkout. Each needs a different path through the same underlying data. Expecting a vendor to anticipate and build every combination just isn't realistic.
We also kept hearing two things from users. Some felt their existing tool was too complicated, even though they only used a fraction of it. Others wanted visualizations and workflows we didn't offer. Building everything the second group asked for risked creating exactly the complexity the first group wanted to escape.
So we decided to try a different approach. We built ClickHouse Observability Apps to let teams generate the experiences they need. Describe an application in natural language, and an agent builds it inside ClickHouse Observability, with its own views and navigation over live data. Refine it through conversation, adapt it as your questions change, and share it with your team.
To make this a little more concrete, here are a few examples. They're a little contrived, but broadly reflect the kinds of requests we hear from users.
"Build me an app that lists and visualizes our infrastructure maps around critical user journeys, such as checkout and sign-in. Let me select a journey, explore its dependencies, and understand each component's criticality based on the journeys and functionality it supports. When a component fails, show which journeys are affected and what that puts at risk for users. Make it useful both for understanding our infrastructure day to day and assessing impact during an incident."
"Build me an app that lists and visualizes our infrastructure maps around critical user journeys, such as checkout and sign-in. Let me select a journey, explore its dependencies, and understand each component's criticality based on the journeys and functionality it supports. When a component fails, show which journeys are affected and what that puts at risk for users. Make it useful both for understanding our infrastructure day to day and assessing impact during an incident."
A component's importance depends on what your customers use it for. A custom visualization can make those relationships visible, even when the product doesn't offer this. No vendor can anticipate every customer's architecture, shared services, and business priorities or the exact visualizations they will need. Instead, let your team build a view that reflects those details without convincing a vendor that enough other customers need the same thing.
"Build me an app that tracks feature flag values alongside application and infrastructure KPIs. Let me select a change, compare affected tenants, and explore the requests behind a performance regression."
"Build me an app that tracks feature flag values alongside application and infrastructure KPIs. Let me select a change, compare affected tenants, and explore the requests behind a performance regression."
An engineer might investigate latency after a rollout, while support needs to identify affected customers. Each can adapt the application around their responsibilities, adding views or changing the investigation as new questions emerge. It might even be worth building this for a single rollout, then discarding it once the question is answered. Alternatively, colleagues can share it, branch it, and refine it into something they use every day.
"Build me a view of payment success by credit card type, compared with each processor’s normal rate. Let me follow failures into the affected orders and their traces. Analyze impact and whether the orders eventually succeeded or not. Look at the last 36 hours of logs, traces, and metrics."
"Build me a view of payment success by credit card type, compared with each processor’s normal rate. Let me follow failures into the affected orders and their traces. Analyze impact and whether the orders eventually succeeded or not. Look at the last 36 hours of logs, traces, and metrics."
The team controls the screens, how they connect, and what happens at each step of the investigation. A processor comparison leads to affected orders, then an order's history, then the familiar trace viewer, carrying the relevant filters and time range throughout. This goes beyond generating a dashboard: the application connects live data and reusable investigation tools around the way your team needs to work.
These applications need freedom in what they can ask of the data. An app limited to fixed query endpoints can mostly repackage the answers those endpoints already provide. A different visualization won't help if the underlying analysis can't answer the question.
Using ClickHouse’s support for SQL has given us room to go much further. The payments application needs to calculate each processor's baseline, link payment attempts to orders, and determine which failures eventually recovered. Combining those results with order data could reveal the value of purchases that are still incomplete. That business logic needs to be expressed somewhere.
It also requires exploration across individual customers, orders, tenants, and requests. The next question might involve a particular deployment or a combination of attributes nobody anticipated. The data and query engine need to support high-cardinality exploration, with sufficient detail and responsiveness to support the investigation.
Some users already do this themselves. Our own observability team writes SQL in Python notebooks to build visualizations that our existing tools don't provide. In one example, a Plotly timeline shows the exact start and end of log scrapes to reveal duplicates. Before investigating the problem, the team had to build the view.
Here, a Plotly chart maps scrape time against wall time, with each rectangle spanning a scrape's exact start and end times. The annotations highlight a window of duplicate scrapes, confirming overlapping data in that range. Before we could investigate the problem, we had to build the visualization. More details here.
Here, a Plotly chart maps scrape time against wall time, with each rectangle spanning a scrape's exact start and end times. The annotations highlight a window of duplicate scrapes, confirming overlapping data in that range. Before we could investigate the problem, we had to build the visualization. More details here.
Agents potentially make this capability accessible to more people. Given the relevant schema and context, they can write and test the queries, then build an application colleagues can explore. As the question changes, the queries and interface can evolve together, with the SQL available to inspect.
The challenge is making sure that analysis answers the question the user intended. A query can run successfully and still count failed attempts when what you needed was customers who couldn't pay. As we discuss below, this is one of the main things we still need to get right.
Generated applications use the same API layer as our investigation tools and MCP server. They can reuse established operations for searching logs, following traces, and comparing events. The work we put into correctness and performance carries over to those applications, keeping common operations consistent across the experiences built on top.
Beneath that sits ClickHouse as a common data layer where logs, traces, and metrics live together in a single data store, allowing correlations to happen in the query engine. When an investigation needs analysis beyond the existing tools, agents can use SQL to join signals, apply business-specific logic, and explore other datasets, with the queries available to inspect.
OpenTelemetry also gives us a documented model of what the data means. Its semantic conventions define attribute names, types, meanings, and expected values across resources, logs, traces, and metrics. For telemetry that follows those conventions, the agent has a specification to work from when interpreting the schema and writing queries. Combined with context about the team's available data sources, this reduces how much it needs to infer.
The same principle applies to the interface. The agent can import reusable UI components and connect them to the existing investigation tools. It can assemble charts, controls, and detail views around the problem, while reusing the behavior and styling we've already built. That means less code to generate and check, and more consistent applications.
The agent starts with context about your team's data sources, schemas, and how to query OpenTelemetry data in ClickStack. It also gets instructions for building applications with the Apps SDK. It tests queries against ClickHouse before putting them into the application, while lint checks catch common SDK and styling mistakes.
The generated app runs in your browser inside a sandboxed iframe. It can't make network requests, navigate elsewhere, load unapproved scripts, or read your ClickStack session directly. Instead, it sends messages requesting specific actions: run a query, open a trace or log drawer, or change the time picker. ClickStack validates those messages, performs the allowed action, and returns the result.
Queries are read-only and run with the viewing user's database permissions. Sharing an app doesn't share its creator's access. You get live data and familiar investigation tools within those boundaries.
From there, you can ask the agent to change the application, fix something, or explore a different approach. If its improvements turn out to be "improvements," you can instantly revert to an earlier version.
A query can run successfully and still answer the wrong question. Counting failed payment attempts isn't the same as counting customers who couldn't pay. Testing queries and checking code catches some mistakes, but it doesn't prove that an application reflects what you meant.
We're still improving our evaluations to measure that alignment, then using the results to improve the agent's context, instructions, and tools. We're also working toward browser-based interaction testing, stronger lint and type checks, and adversarial review. The aim is to give the agent better ways to find its own mistakes before you do. RBAC and sandboxing provide enforced boundaries, but we will still be improving robustness to prompt injection before beta. Currently, we explicitly mark query results, existing app code, previous users' prompts, and error messages as untrusted input. A log entry can contain instructions; that doesn't mean it gets to give orders. This reduces the risk, but we don't treat this as a solved problem while the feature remains in private preview.
We're also extending our reusable components with established query logic and behavior, so agents don't have to invent every chart and filter from scratch. Further out, we want teams to build and manage apps through their own agents over MCP and through configuration as code.
Observability Apps, now in private preview, puts the power of SQL in your team's hands. Describe the question, let an agent build the analysis, and turn it into an interactive application your colleagues can explore without writing the queries themselves.
We want to see the awkward questions, the business-specific logic, and the investigations that don't fit the usual screens.
SQL gives you the freedom to ask. Your interface should give you the freedom to explore.