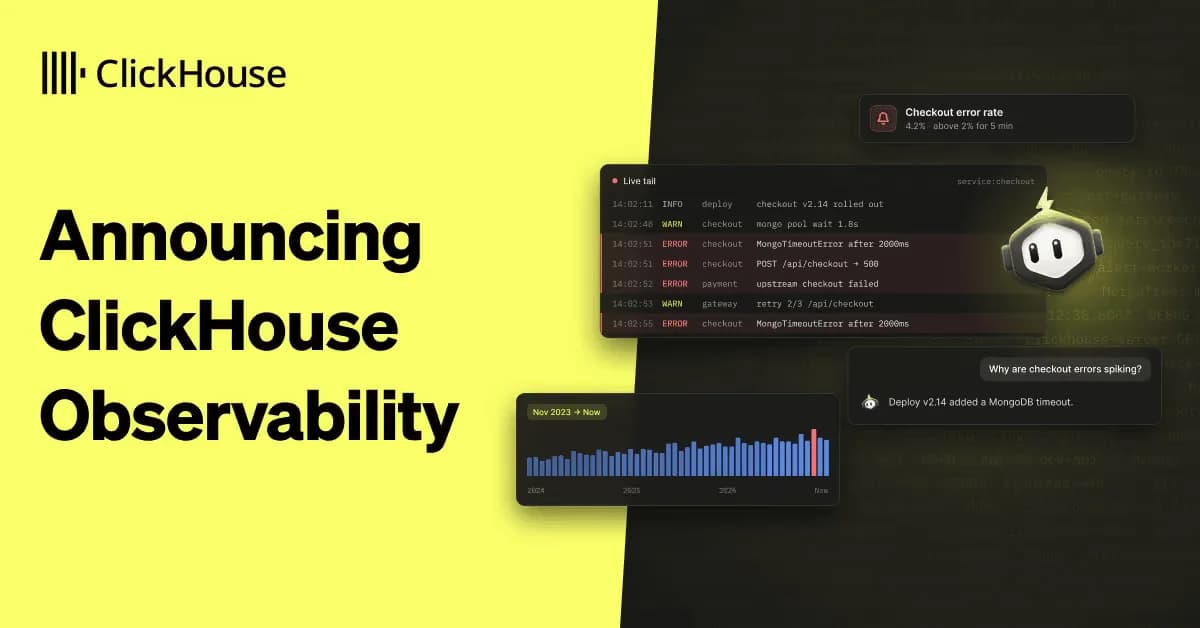
Today, we're introducing ClickHouse Observability in public beta: a fully managed observability solution for SREs and their agents, powered by ClickHouse Cloud and open-source ClickStack.
Send your OpenTelemetry data to a managed OTLP endpoint, and we'll handle the rest. You get ClickHouse's query performance without having to size compute, tune your database and schemas, or manage ingestion.
Thanks to ClickHouse's efficiency, we can offer market-leading pricing with a fully managed service and keep it simple: just gigabytes ingested for logs and traces ($0.20/GB), and data points ingested for metrics ($0.10/M).
Get the benefits of ClickHouse for observability in minutes, with full-fidelity logs, metrics, and traces ready to investigate. Explore your telemetry through the ClickStack UI or connect your own agents through purpose-built MCP tools and SQL. Focus on understanding production and resolving failures while we operate the platform.
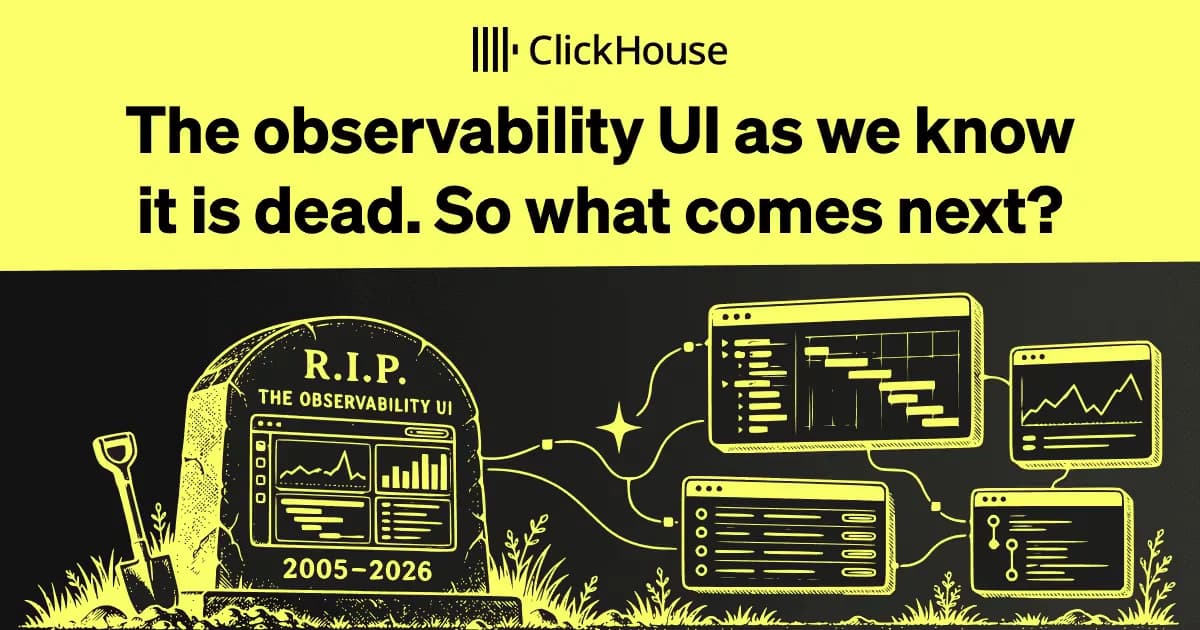
We're also announcing ClickHouse Observability Apps in private preview. While ClickHouse Observability makes the benefits of ClickHouse easier to access, Apps addresses a larger question: if agents can investigate and software can adapt to the task, why should observability interfaces stay fixed?
With Observability Apps, you describe what you need and build an interactive custom observability UI around your company, your use case, your team, your role, or even an individual investigation. Agents can use purpose-built investigation tools and SQL to turn those questions into an experience you can explore, refine, and share.
The benefits of ClickHouse for observability are well established.Leading enterprises, such as Netflix,Anthropic, Twilio, andOpenAI, use it to store and query telemetry at an enormous scale.
This is thanks to high compression, fast queries, and efficient storage, which make it practical to preserve full-fidelity telemetry with no sampling and more history. Combined with expressive SQL, this gives engineers and agents the rich context they need to investigate and diagnose issues.
ClickHouse's efficiency has changed what teams can afford to keep and investigate. We've steadily lowered the barrier to those benefits over the last year with open source and Managed ClickStack, but database expertise, managing ingestion and infrastructure, have remained part of the equation.
That control remains valuable for teams with the expertise and scale to justify the investment. But many teams want to investigate their applications without also administering an observability database. And as agents run more investigations, teams shouldn't have to keep revisiting capacity decisions to accommodate agents.
With ClickHouse Observability, we're removing these requirements.
"ClickHouse powers Buildkite’s Test Engine, ingesting over a trillion test executions a month with just 10 seconds of ingestion latency. We’re excited to build on that success with ClickHouse Observability to better understand our own CI. In the private preview, connecting Buildkite’s OpenTelemetry integration to the ClickStackUI OTLP endpoint was straightforward. The ClickStack agent created a dashboard in minutes that let us drill into individual jobs, track overall pipeline performance over time, and slice and dice by step, agent tags, and more. We’re excited for Buildkite customers to try this with their own pipelines. Chris Atkins, Distinguished Engineer, BuildKite
"ClickHouse powers Buildkite’s Test Engine, ingesting over a trillion test executions a month with just 10 seconds of ingestion latency. We’re excited to build on that success with ClickHouse Observability to better understand our own CI. In the private preview, connecting Buildkite’s OpenTelemetry integration to the ClickStackUI OTLP endpoint was straightforward. The ClickStack agent created a dashboard in minutes that let us drill into individual jobs, track overall pipeline performance over time, and slice and dice by step, agent tags, and more. We’re excited for Buildkite customers to try this with their own pipelines.
Chris Atkins, Distinguished Engineer, BuildKite
ClickHouse Observability makes that work our responsibility. You decide what telemetry to send and what questions to ask. We manage the database and the infrastructure behind it. Just send data and start investigating.
To get started, create a ClickHouse Observability service to get your managed OTLP endpoint and credentials. Point your OpenTelemetry collectors at that endpoint, keeping your existing instrumentation and collection pipelines.
From there, we handle ingestion, schemas, and storage. Separate compute for ingestion and queries lets us automatically adjust investigation capacity as demand grows, without asking you to size or tune the underlying services.
Once telemetry arrives, you're ready to investigate. Search logs, explore metrics, and follow traces in the ClickStack UI. Turn useful queries into dashboards and alerts your team can return to.
The same telemetry is available to your agents through the included ClickStack MCP server. Purpose-built tools let them search logs, follow traces, and analyze event patterns and deltas. SQL lets them go further: joining signals, comparing historical behavior, and testing questions the predefined tools don't cover.
“It’s absolutely mission-critical, our ability to function as a small team and still ship a lot of features, but also maintain a high-quality service. That’s just impossible without that always-on, AI-assisted triage, which is amazing with an off-the-shelf agent and just access to ClickHouse Observability.” Matt Matheson, Co-Founder and CTO, Trunk.io
“It’s absolutely mission-critical, our ability to function as a small team and still ship a lot of features, but also maintain a high-quality service. That’s just impossible without that always-on, AI-assisted triage, which is amazing with an off-the-shelf agent and just access to ClickHouse Observability.”
Matt Matheson, Co-Founder and CTO, Trunk.io
Historically, running observability on ClickHouse Cloud meant paying for compute and storage. That gives teams control, but estimating the bill requires understanding the resources their workload needs. Without that understanding, teams often overprovision to be safe, paying for capacity they don't use.
We also believe pricing should be easy to understand, with as few dimensions as possible. We've chosen two familiar measures: the volume of logs and traces you send, and the number of metric data points. Charging for metrics by data points rather than unique time series means adding useful dimensions doesn't introduce a separate cardinality charge - ClickHouse doesn't suffer with cardinality, so neither should you.
During public beta, both are available at a 50% discount.
Logs and traces are billed on the uncompressed volume ingested each month. Metrics are billed on the data points ingested each month. Both include 30 days of retention during public beta, with longer retention planned for general availability.
Making ClickHouse's capabilities accessible through a managed experience gives more teams full-fidelity telemetry without the burden of operating the database.
The next step is giving those teams the freedom to shape how they investigate. Core workflows for searching logs and following traces still matter. But every business has systems, responsibilities, and questions that a vendor's screens won't fully accommodate. Your observability experience shouldn't have to wait for a place on someone else's roadmap.
ClickHouse Observability Apps, now in private preview, lets you describe the experience you want and build a custom application around your live data, without writing application code. The agent generates the queries, custom visualizations, and connected screens. You can refine them through conversation and share the application with your team. SQL provides the freedom to explore individual customers, tenants, and transactions, with the queries available to inspect.
A payments team could compare success rates against each processor's usual performance, follow an anomaly into affected orders, and see which succeeded after a retry. From an order, they could open the underlying trace, carrying context through the investigation. Support might need a different starting point, organized around the customer's incomplete purchase.
An application can be worth creating for a single investigation, then evolve into something the team uses every day. Each user and team gets the freedom to build an experience around their questions, while familiar investigation tools remain part of the workflow.
We designed Observability Apps around three principles: security, live data, and an interactive experience integrated with ClickStack. Generated code runs in a sandbox, and queries are read-only and use the viewing user's database permissions. Apps reuse the API layer behind our investigation tools and MCP server, with SQL available for analysis beyond those established operations.
Build an application for a specific incident, then share it with your team and reuse it as the data changes. ClickStack's time picker and trace and log viewers connect custom screens to familiar investigation tools, so you can follow a question into the underlying evidence while keeping context.
Teams can shape their own experience as their questions evolve, without waiting for a vendor to design every screen. Core investigation tools become reusable components within applications built around each team's needs. In ourdedicated post, we explore what this means for observability and the work still needed to make generated experiences consistent and correct.
During beta, we're focused on improving automatic scaling and schema optimization. We're building on capabilities such as On-Demand Compute to make query capacity more responsive to bursts of investigations from engineers and agents. We're also improving how the service adapts schemas to your telemetry and query patterns, taking more tuning decisions off your team's hands.
Bring your telemetry and your real investigation workflows. Your feedback will help us decide what to improve as we work toward general availability.
Managed ClickStack becomes a self-configured option within ClickHouse Observability. You keep the ClickStack UI and investigation tools, with control over your database, schemas, tuning, and compute configuration. ClickHouse Cloud continues to manage the underlying infrastructure.
Self configued ClickHouse Observability remains a good fit for teams with database expertise and the scale to justify that engineering investment in pursuit of the lowest unit costs. For most teams, the default experience should be the starting point: send telemetry, investigate, and leave database operations to us.
Self configued ClickHouse Observability remains a good fit for teams with database expertise and the scale to justify that engineering investment in pursuit of the lowest unit costs. For most teams, the default experience should be the starting point: send telemetry, investigate, and leave database operations to us.
ClickStack remains open source, and we remain fully committed to its continued development. We'll keep investing in our open source roots and delivering a great out-of-the-box experience for teams that want to run observability themselves on ClickHouse. You can deploy the stack on your own infrastructure, adapt it to your needs, and connect your agents through MCP and SQL. ClickStack continues to provide the foundation for ClickHouse Observability.
Users can get started today in a few minutes. Create a ClickHouse Observability service, send telemetry to your managed endpoint, and start investigating. Explore your data in the ClickStack UI or connect your agents through MCP and SQL. We'll handle the platform so you can focus on understanding production.
Join the Observability Apps private preview
Join the observability apps private preview and help shape the direction of generated apps in ClickHouse Observability.