Shopify, Squarespace, Webflow and other website builders/content management systems offer analytics within their platforms. What can those reports tell you, why do their numbers differ from other tools and can you export the data? The answers depend on which platform you use.
You should be able to answer website performance questions without collecting more personal data or taking on Google Analytics’ complexity. While you also should not have to buy another tool to get information your website platform already provides, unless it really adds value.
This guide discusses capabilities of popular content management systems’ or website builders analytics, includes common doubts and questions people have about each platform, then looks at when independent analytics solves a problem.
- What can your platform’s analytics actually tell you? Squarespace Can I trust the numbers and export a report? Wix Why do its numbers disagree with Google Analytics? Shopify Why do I have orders without matching tracked conversions? WordPress.com What do the built-in stats include? Ghost Do I still need separate analytics after Ghost 6.0? Webflow Can Analyze export data, and is it cookie-free?
- Squarespace Can I trust the numbers and export a report?
- Can I trust the numbers and export a report?
- Wix Why do its numbers disagree with Google Analytics?
- Why do its numbers disagree with Google Analytics?
- Shopify Why do I have orders without matching tracked conversions?
- Why do I have orders without matching tracked conversions?
- WordPress.com What do the built-in stats include?
- What do the built-in stats include?
- Ghost Do I still need separate analytics after Ghost 6.0?
- Do I still need separate analytics after Ghost 6.0?
- Webflow Can Analyze export data, and is it cookie-free?
- Can Analyze export data, and is it cookie-free?
- What native built-in analytics are good at
- When independent analytics solves a problem You need to answer questions beyond the platform’s standard reports You need one set of metrics across several sites You need to understand what affects data accuracy You want a different approach to visitor privacy You need ownership, exports and reporting outside the CMS You want analytics to be the provider’s main product
- You need to answer questions beyond the platform’s standard reports
- You need one set of metrics across several sites
- You need to understand what affects data accuracy
- You want a different approach to visitor privacy
- You need ownership, exports and reporting outside the CMS
- You want analytics to be the provider’s main product
- How Plausible extends built-in CMS analytics Which campaigns and pages lead to a result? How do you add it to your existing site? Which Google searches bring people to your pages? Can you combine sites and send reports to clients? What visitor data does Plausible collect?
- Which campaigns and pages lead to a result?
- How do you add it to your existing site?
- Which Google searches bring people to your pages?
- Can you combine sites and send reports to clients?
- What visitor data does Plausible collect?
- Frequently asked questions
What can your platform’s analytics actually tell you?
Squarespace
Squarespace is a website builder for publishing content, selling products and running membership sites.
Squarespace Analytics shows visits and unique visitors over time, which pages people view, how they found the site and which search terms brought them there. Depending on your plan and commerce setup, it can also report form and button conversions, sales, purchase-funnel activity and abandoned carts.
Its official analytics guide lists the panels available and the plans that include them. For checking which pages get attention or whether traffic is growing, it may already provide enough information.
Can I trust the numbers and export a report?
Squarespace currently says that analytics reports cannot be exported. If a spreadsheet is part of your monthly reporting, that is a concrete limitation.
Visitor counts need some context too. Squarespace explains that when analytics cookies are disabled, each pageview counts as its own visit. One person reading several pages can therefore produce several visits. Attribution and conversion reporting can also be affected. How Squarespace’s cookie settings change analytics.
So a higher count than Google Analytics does not, by itself, mean Squarespace found more people. Check the consent settings and compare the same metric before judging either total.
For monthly reporting, distinguish between checking trends in Squarespace and delivering a spreadsheet of those trends. The dashboard supports the first task; its lack of analytics exports prevents the second.
Wix
Wix is a website builder with integrated tools for running an online business.
Wix Analytics shows sessions, unique visitors, traffic sources, entry pages, locations, devices and new versus returning visitors. Sites using Wix business apps can also get reports for sales, stores, bookings, events and other app-specific activity. Its analytics guides explain the available reports, sharing and alerts.
Unlike Squarespace, Wix lets you download analytics reports as CSV files and schedule report emails. Scheduled reports are delivered as CSV attachments in table view. Downloading charts as CSV, PNG or SVG files requires Analytics Pro. You do not need another analytics tool solely to export a standard report table from Wix.
Why do its numbers disagree with Google Analytics?
The totals can differ because the tools may not observe the same visits. When Wix’s cookie banner is active, Wix Analytics collects data only after a visitor accepts analytics cookies. Wix and Google also use different bot-filtering methods, so traffic removed by one tool may remain in the other. Wix describes both causes in its discrepancy guide, while its cookie-banner documentation explains how consent controls collection.
That is why the first step is to make the comparison equivalent. Match sessions with sessions over the same dates and time zone, then confirm that both tools run on the same pages, follow the intended consent settings and handle your own visits as expected. If the disputed metric is time on page, compare its definition too: Wix calculates time from the gap between pageviews, so it cannot calculate the metric for a visit that never moves to another page.
Even after those checks, the totals do not need to match exactly. For recurring client reports, choose one source and state what it counts. Treat a sudden gap between the tools as a reason to inspect the setup before presenting it as a real change in traffic.
Shopify
Shopify is an ecommerce platform for managing storefronts, orders, products and customers.
Shopify Analytics shows sales, orders, online-store sessions, conversion rate and other store activity from the Shopify admin. More detailed reports cover acquisition, customer behavior, finances, inventory, marketing and product performance, with availability depending on your Shopify plan. You can export most reports from the admin, including as CSV files for spreadsheet analysis. Our Shopify Analytics guide walks through the dashboard and report categories.
Why do I have orders without matching tracked conversions?
Shopify counts orders and converted sessions differently. One session can produce multiple separate purchases, which creates multiple orders but only one converted session. Shopify also documents that consent choices can reduce the session data available for reporting. Shopify’s customer and session discrepancy guide.
Use your order records to establish which purchases happened. Use traffic and conversion reporting to investigate how measured visits led to them. Do not assume that every missing analytics conversion means a missing sale.
Also check for measurement changes. Shopify’s September 21–23, 2026 rollout changed session handling and filtered identified bot sessions out of session-related reports by default. Shopify says this can change sessions and conversion rates without changing order or sales counts. Shopify’s update.
A change in reported conversion rate therefore needs two checks: did sales change, or did the number of measured sessions change? Review both before concluding that checkout performance has improved or declined.
WordPress.com
WordPress.com is a managed hosting platform for building and publishing WordPress sites.
WordPress.com includes Jetpack Stats. Other WordPress sites may use a different analytics plugin, so first check which tool supplies the stats in your dashboard.
Jetpack Stats shows views and visitors, popular posts and pages, referrers, locations, devices, outbound-link clicks and subscriber activity. Historical access and more detailed reports depend on the WordPress.com plan. It supports CSV downloads, although its all-time most-viewed list and corresponding export are limited to the top 500 posts and pages. WordPress.com’s stats guide.
What do the built-in stats include?
WordPress.com defines a visitor as an individual it recognizes in the selected period and a view as a page load or reload. One visitor reading three posts can therefore generate three views. A higher view count than visitor count is expected when people read more than one page. WordPress.com’s traffic guide explains how both metrics are counted.
Before paying for another tool to access older reports, check whether the history or export you need is already available on your WordPress.com plan.
Ghost
Ghost is a publishing platform built around websites, newsletters and memberships.
Ghost shows unique visitors, total views, top content and traffic sources, with filters for public visitors, free members and paid members. Separate reports cover newsletter subscribers, open and click rates, membership growth and recurring revenue. Its web analytics is cookie-free, although Ghost records member IDs and membership status for logged-in readers. Ghost’s analytics documentation.
Do I still need separate analytics after Ghost 6.0?
Whether you still need separate analytics depends on what you need to measure beyond Ghost. If your questions are which articles attract readers and which content brings members, Ghost already connects those results and provides cookie-free traffic measurement.
A separate tool adds value when it answers something Ghost does not, such as reporting across other sites, tracking particular website actions or maintaining continuity with analytics you already use.
History is a separate consideration. Ghost that its native web analytics starts with Ghost 6.0 and cannot import data from third-party analytics tools. If you already have years of reporting elsewhere, switching entirely to Ghost affects the comparisons you can make in the new dashboard.
Webflow
Webflow is a visual website builder and content management system.
Webflow Analyze is an add-on that reports sessions, unique visitors, bounce rate, time on page, traffic sources, devices and click behavior. You can also define goals for clicks on specific buttons and links. The official Webflow Analyze documentation explains its site overview, goals and page-level insights.
Can Analyze export data, and is it cookie-free?
Analyze uses local storage rather than cookies to recognize visitors. Webflow says privacy compliance depends on the tracking mode and consent setup. It also says historical analytics becomes inaccessible when Analyze is disabled.
Exports are supported. Webflow introduced CSV exports in April 2026. You can take supported chart and table data into a spreadsheet for client reports or further analysis.
If you plan to stop using Analyze, export the reports you need before disabling it. Cookie-free collection and continued access to reporting are separate questions.
What native built-in analytics are good at
Native reporting has a clear advantage when the question belongs to the platform’s own work: products and orders in Shopify, newsletters and memberships in Ghost or published content in WordPress.com.
It also puts reporting somewhere you already visit. If you only need a regular check of traffic and popular pages, an existing dashboard can be enough.
For a monthly review, start with the reports already available: traffic trends, popular pages and the sales or membership results relevant to your site. Check the date range and try an export. That establishes what you can report today and what, if anything, is missing.
When independent analytics solves a problem
Built-in analytics is strongest when the question stays inside one platform. Independent analytics becomes useful when the question crosses that boundary: another site, a campaign, a CMS migration or a requirement the platform was not designed to meet.
You need to answer questions beyond the platform’s standard reports
A platform decides which reports make sense for most of its customers. Your questions may be more specific: Which campaign produced qualified enquiries? Where do people leave a signup or checkout flow? What do visitors read before purchasing? How much revenue came from a landing page rather than simply how many orders were placed?
Independent analytics can add custom conversions, campaign attribution, funnels, visitor paths, segmentation and integrations with search or advertising data. These capabilities only add value when they answer a real question. More reports do not make the data more useful by themselves.
You need one set of metrics across several sites
A Shopify store and a separate WordPress publication may both have useful reports, but they may define visits, engagement and conversions differently. Reviewing them together means reconciling dashboards before interpreting the result.
Using one analytics tool across those sites provides a common measurement method, date range and conversion vocabulary. This is useful for agencies, organisations with regional sites and businesses whose store, blog and marketing pages run on different systems. It still requires correct installation on every site and consistent definitions for outcomes such as signups or enquiries.
You need to understand what affects data accuracy
No analytics tool records an unquestionable version of reality. Visitor counts change with consent choices, blocked scripts, bot filtering, internal traffic, time zones and the way a tool defines a visit or a unique visitor. A platform may also count an order, member or subscriber from its own database while a web analytics tool counts only activity it observed on the site.
An independent tool gives you another collection method and more control over exclusions, events and definitions. That can produce a dataset better suited to your questions, but independence alone does not make it accurate. Check what is collected, what is filtered and which activity is missed before comparing numbers between tools.
You want a different approach to visitor privacy
Privacy depends on how analytics recognizes visitors and what happens to the resulting data. Relevant questions include whether it uses cookies or persistent identifiers, whether it creates profiles across days or sites, where the data is processed and whether it is used for advertising.
Consent can affect the reports themselves. Wix says visitors who do not consent to analytics cookies are omitted from its reports. Squarespace says disabling analytics cookies can prevent it from connecting activity into one visit. In those cases, consent changes which activity is measured or how visits are counted.
An independent tool can offer a measurement model that does not rely on analytics cookies or persistent visitor profiles. The tradeoff may be less information about an individual’s behaviour across days or devices. For many sites, aggregate answers about pages, sources and conversions are enough. Other services on the site may still require consent.
You need ownership, exports and reporting outside the CMS
Access to a dashboard is not the same as control over the data. You may need to export a complete history, automate a report through an API, combine website data with another source or give a client access without also opening the CMS.
Check what can be exported, the level of detail included, row or date limits and what happens when the subscription ends. Also check whether the provider lets you delete the data and whether it uses that data for any purpose beyond providing analytics.
Keeping analytics separate can also preserve one reporting history through a redesign, domain change or move to another CMS. You still need to install and verify tracking on the new site. An independent tool cannot recreate visits that were never recorded and importing old data depends on what the previous tool can export.
You want analytics to be the provider’s main product
Analytics is one feature among many for a CMS or website builder. Its development competes with editing, hosting, commerce and account-management work. A dedicated analytics provider succeeds or fails on the quality of its measurement, reporting, integrations and support.
That focus does not guarantee a better product. It does give you a useful way to assess one: review its documentation, release history, support for your platform and response to changes in browsers, privacy rules and marketing channels. The question is whether analytics is important enough to your work to justify a tool whose roadmap centres on it.
How Plausible extends built-in CMS analytics
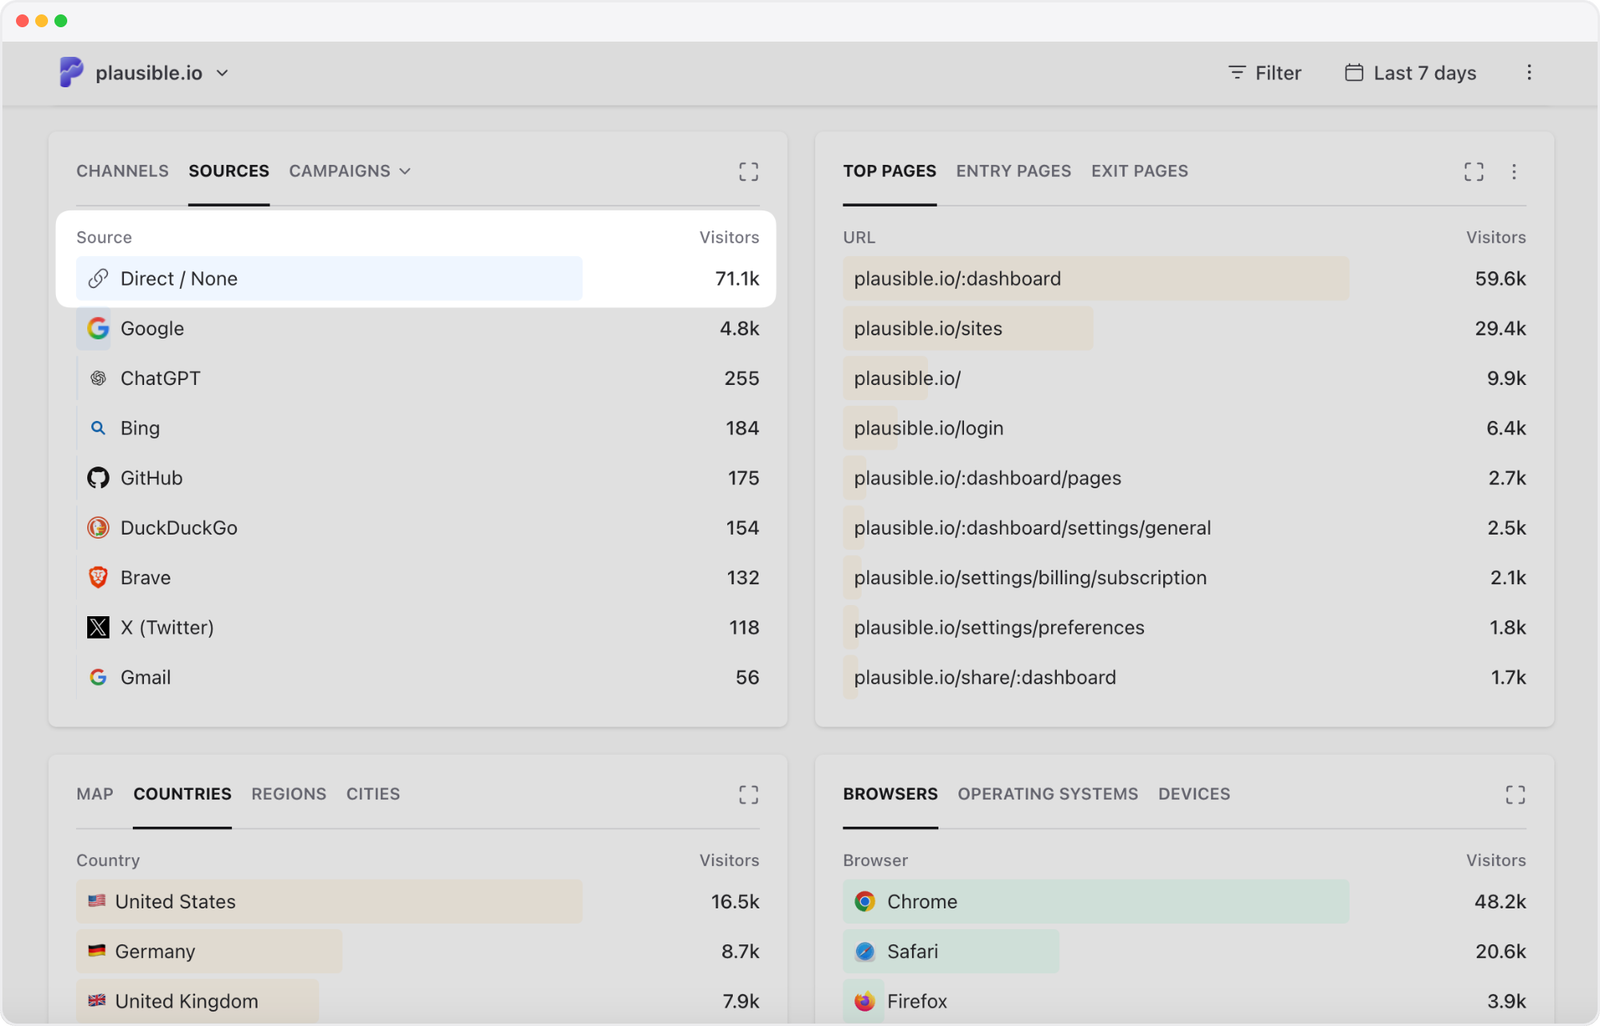
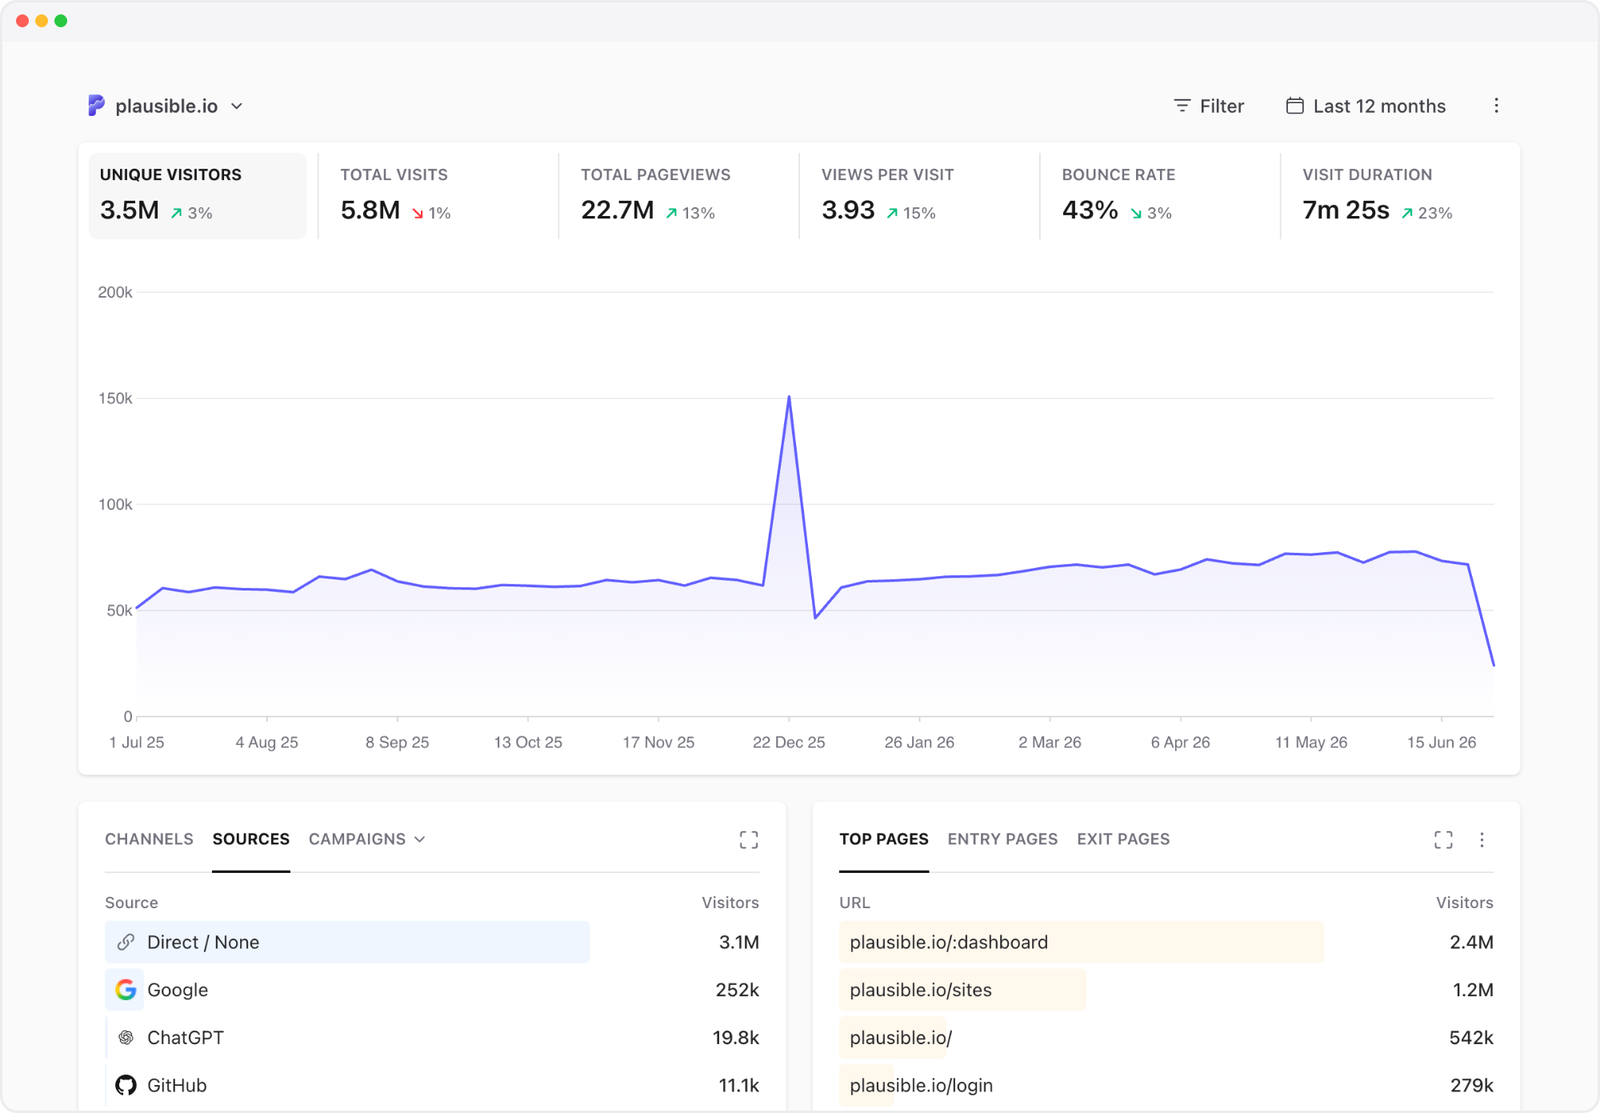
Plausible is an independent, privacy-friendly web analytics tool built as a simpler alternative to Google Analytics. It works alongside your CMS rather than replacing the reports that belong there, such as Shopify orders, Ghost memberships or newsletter delivery.
The aim is to make the website journey understandable in one place. The dashboard connects where measured visits came from, which content people used and which visits produced a signup, enquiry or sale. It does this without cookies, persistent visitor identifiers or the layers of reports and configuration associated with Google Analytics.
Which campaigns and pages lead to a result?
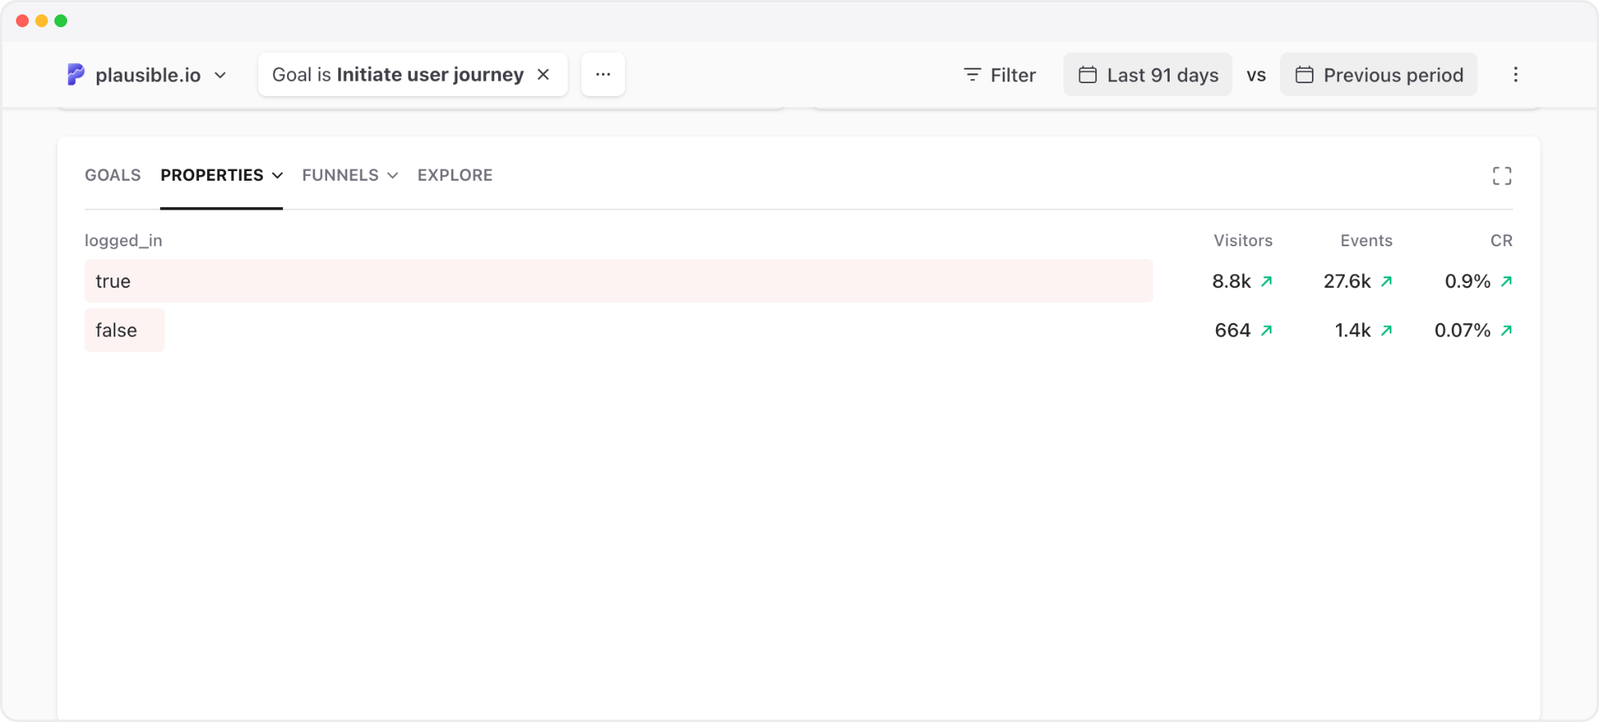
Use goals and conversions to define results such as enquiries, signups, downloads or purchases. You can then filter the dashboard by campaign, source, landing page, device or location and see the pages and behaviour associated with that result.
For example, one article may attract the most readers while another produces more enquiries. Looking at traffic and goals together makes that distinction visible. If revenue values are configured, revenue attribution can show which campaigns, sources and landing pages brought sales rather than simply how many orders the store processed.
For a path you already know, Funnel analysis on the Business plan shows completion and drop-off between steps. User journeys, also on the Business plan, work in the other direction: start with a page or event and see what people did next, or start with a conversion and work backwards to what led there. Both depend on the relevant pages and events being measured correctly.
How do you add it to your existing site?
If your site runs on WordPress, the official WordPress plugin handles installation and lets you view Plausible inside WordPress. It can also exclude logged-in administrators, enable enhanced measurements and track WooCommerce revenue. The WordPress setup guide explains which options to enable.
For Shopify, the Shopify integration guide covers both storefront activity and customer events such as add to cart, checkout and purchase. The setup uses a script and a custom pixel. Adding only the theme script does not measure checkout pages, so the custom pixel matters if you want the complete purchase journey.
There are also specific setup guides for Squarespace, Wix, Webflow and Ghost. These links are most useful after you decide that the platform’s own reports leave a gap. Check your website plan’s custom-code requirements before installing.
Which Google searches bring people to your pages?
Google no longer includes search terms in the referral information sent when someone clicks a result, so a web analytics script cannot recover them on its own. The Google Search Console integration brings queries, clicks, impressions, click-through rate and position into Plausible. You can examine search terms for a page, country or device segment alongside the traffic and conversions already in the dashboard.
The integration uses Search Console data, with a reporting delay of about 24 to 36 hours and Google’s sampling and privacy limits. You can filter search query data by page, country or device. With goals configured, you can also see which search keywords and landing pages are associated with signups or purchases. The reporting is aggregated and does not identify the person behind a query or purchase.
Can you combine sites and send reports to clients?
You can manage sites together, give colleagues or clients role-based dashboard access and use private shared links without giving them access to the underlying CMS.
Consolidated View combines native traffic data from sites in a team. It excludes imported history and revenue goals. It aggregates site activity rather than identifying the same person across unrelated websites. Consolidated View details.
For reports outside Plausible, there are CSV exports or choose another option for accessing your data, such as the Stats API. Dashboard exports have row limits and the separate full native-stats export excludes imported data. If you are moving from another tool, check the historical import requirements before assuming its data can be transferred.
What visitor data does Plausible collect?
Plausible does not use cookies, local storage or persistent browser identifiers to track visitors. We do not store raw IP addresses, build personal profiles or use your website data for advertising. Daily visitor identifiers are limited to one site and device, then reset every 24 hours. You retain ownership of your data, which is processed and stored in the EU. Our data policy explains the method and service providers.
The tradeoff is intentional: you cannot use Plausible to recognize an identifiable person returning days later. Other services on your website may still require consent even though Plausible itself does not require an analytics cookie banner.
If your current reports already answer your questions, there is no reporting gap to fill. If one of these needs remains, you can explore the live dashboard or try Plausible alongside your existing setup. Include the subscription and any platform upgrade needed for custom scripts in the comparison.
Frequently asked questions
No. Squarespace currently says its analytics reports cannot be exported. Orders or other downloadable site data should not be confused with traffic-report exports. A separate analytics installation can provide exportable reporting going forward, but it cannot automatically recover your old Squarespace stats. See Squarespace’s current answer.
Not necessarily. Search Console counts clicks that lead from Google results to your site, while Wix counts sessions recorded on the website. One click does not map one-to-one to one session. Google can count repeated clicks differently depending on the result and report aggregation, while Wix ends a session after 30 minutes of inactivity. Wix also says traffic from visitors who do not accept cookies, or who use certain ad blockers, does not appear in its traffic reports. Align the dates and definitions, then investigate a sudden change rather than expecting the totals to match. See Google’s click-counting documentation and Wix’s Traffic Overview and discrepancy guide.
Shopify can report more orders than converted sessions because one session can contain multiple separate purchases. Consent choices can also reduce session counts and other session-based metrics. Compare orders with converted sessions rather than expecting them to match. Shopify explains both causes in its customer and session discrepancy guide.