News Releases TeamCity
Introducing Warm Agents, a TeamCity Plugin
Waiting on “waiting for a starting agent” is a special kind of annoying when you just want your PR tests to run. It stings most when a quick one-minute build sits in the queue for ten minutes while that one slow Windows cloud instance spins up.
The Warm Agents plugin is our answer to this delay.
With this plugin, TeamCity maintains a target count of idle, pre-started agents for a given cloud image. Whenever the number of idle agents drops below your target, TeamCity immediately provisions a new one – ensuring builds start the moment they arrive. The plugin works with any cloud provider supported by TeamCity.
There’s just one thing to budget for up front. Each running warm agent consumes a build agent license, and idle cloud instances still cost money with your provider. Warm agents trade cost for latency, so pick a target that reflects how much queue time you actually want to buy back.
Prerequisites
- TeamCity 2024.12.3 or later.
- A cloud profile and a cloud image configured in a project.
- The “Manage project’s agent cloud profiles” permission granted in the project.
- The Warm Agents plugin, installed and enabled.
To get started with the plugin, go to Admin | Plugins, click Browse plugins repository, and find Warm Agents in the JetBrains Marketplace listing. Install and then enable it.
Once the plugin is operational, make REST API calls to configure warm agents. This article illustrates how to do this using teamcity-cli, the most convenient way to manage your server from a terminal. If you would rather call the endpoints directly, see our REST API Quick Start guide and example requests in the repository.
Setup
To keep ten idle agents ready for a cloud image, run:
To stop maintaining warm agents for an image, pass target=0.
If your cloud image has a hard limit of total running agents configured, TeamCity will respect that, although it is still possible to set the target to a higher value.
To verify the configuration, call:
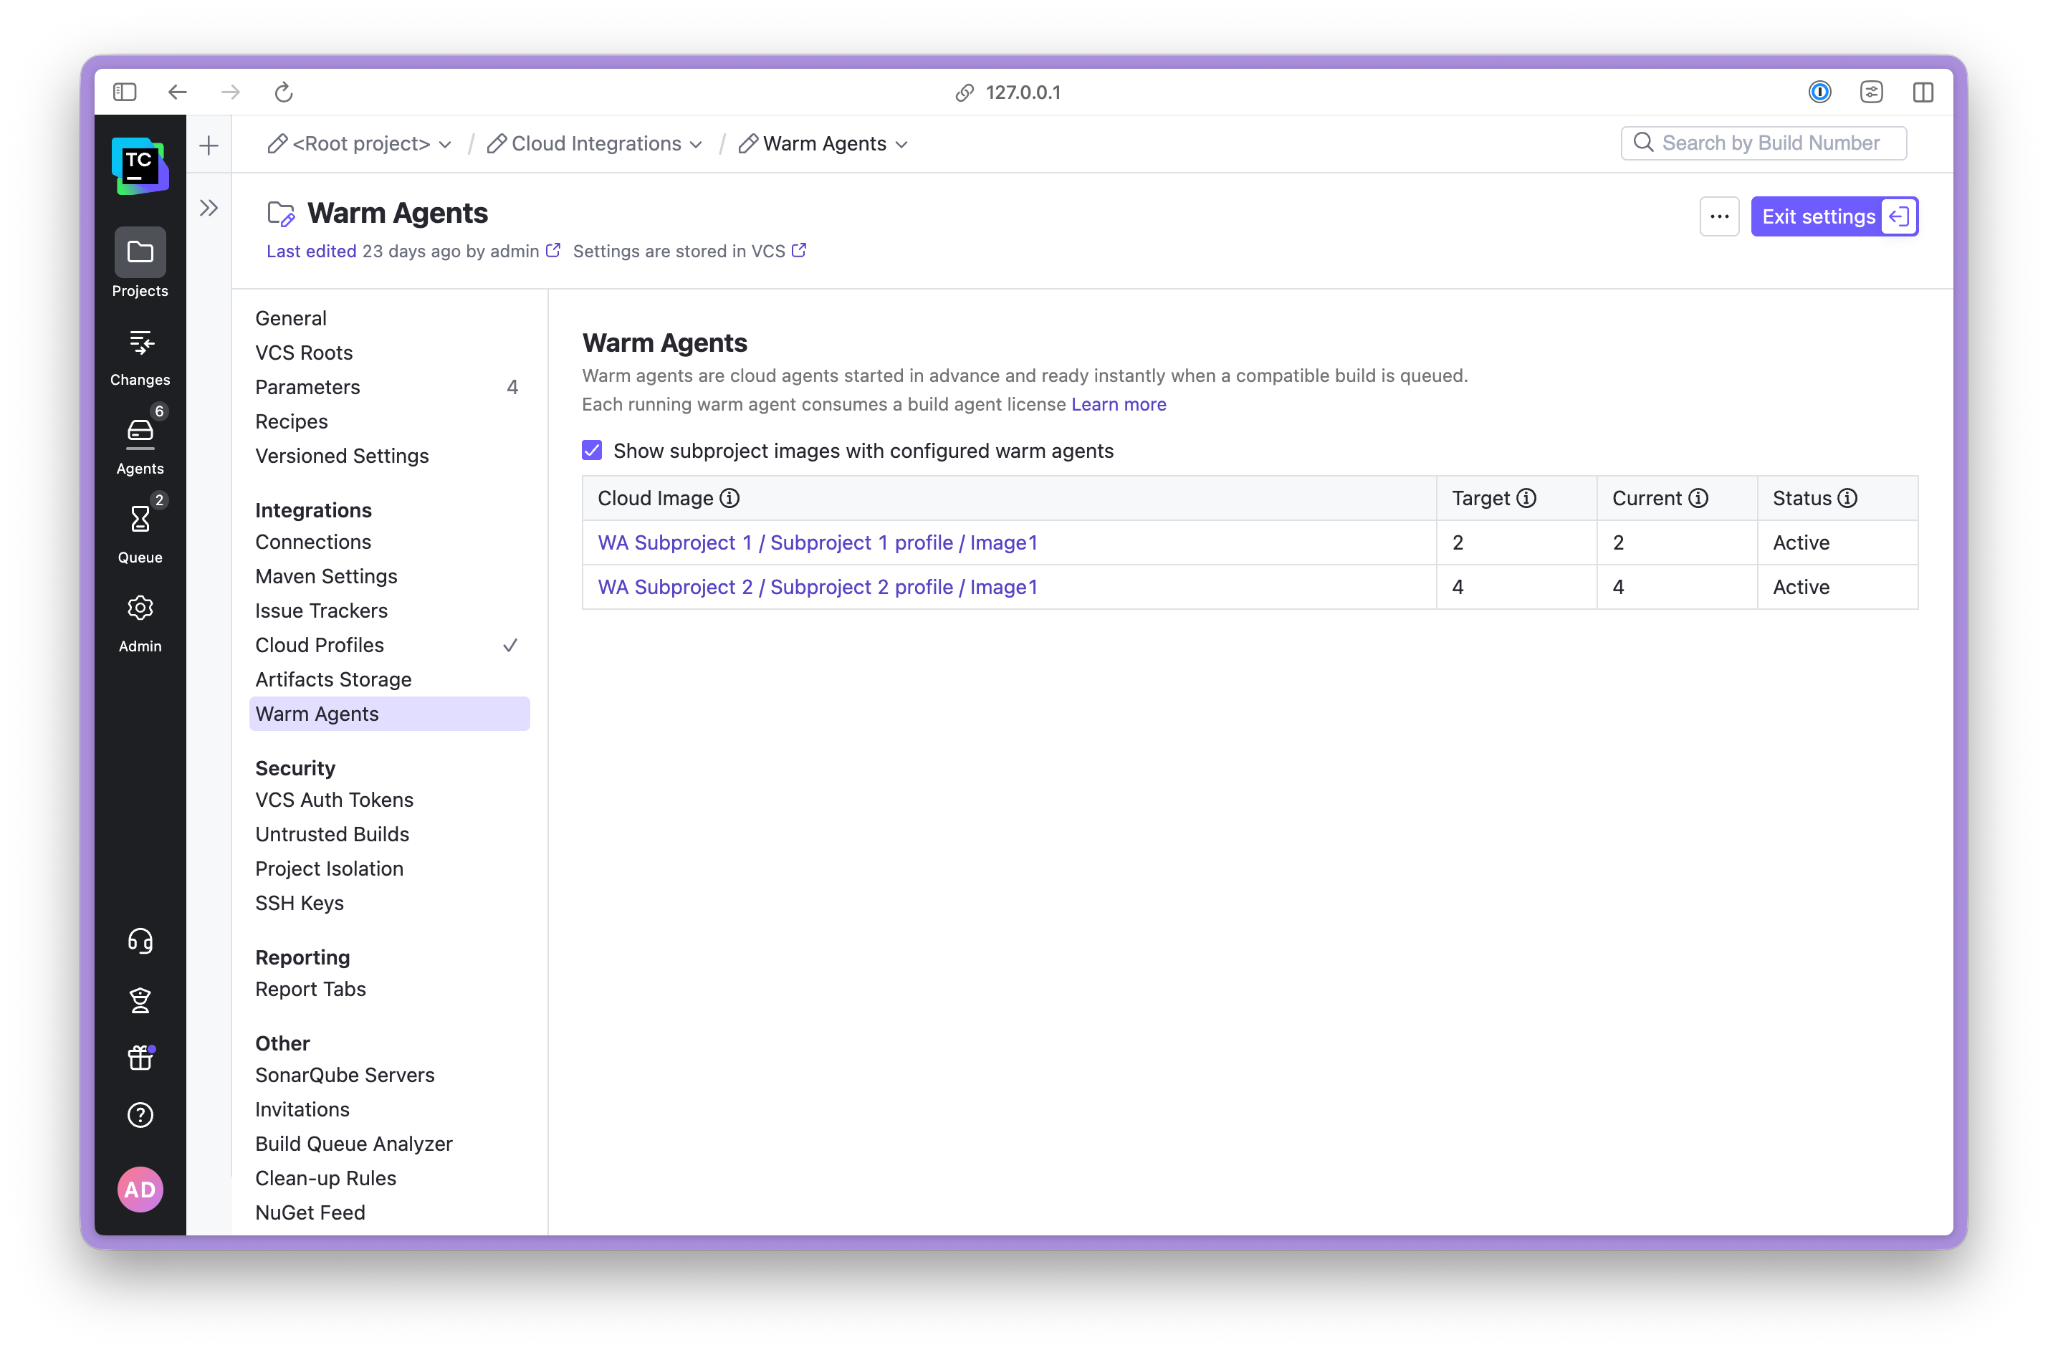
Alternatively, navigate to Project Settings | Integrations | Warm Agents:
TeamCity monitors the number of idle agents for the image and starts new instances whenever the count drops below the target. Note that instances start in batches, with short delays between them, so a high target might take a while to fill.
To find the IDs used above, use teamcity-cli or the REST API:
- teamcity project list
- teamcity project cloud profile list --project <projectExternalID>
- teamcity project cloud image list --project --profile Use only the name: teamcity-linux-aws-a (lt-0cd4ecf32d77770a9) -> teamcity-linux-aws-a
- Use only the name: teamcity-linux-aws-a (lt-0cd4ecf32d77770a9) -> teamcity-linux-aws-a
Alternatively, open the cloud profile page on your server and read the IDs out of the URL: Look for projectId=My_Project and profileId=amazon-123 in an address like my.teamcity.com/admin/editProject.html.
Advanced Usage
Demand for warm agents rarely stays flat. Keeping agents warm overnight can burn resources for no return, so the feature is built for frequent target changes. TeamCity picks up a new target on the fly and adjusts by launching more or fewer agents. Changing the target never affects agents that are already running – TeamCity does not forcibly stop instances when you scale down. The “idle timeout” configuration of your cloud image still applies, although TeamCity might restart some instances that just went down to maintain the agent count.
A schedule is the obvious application. Configure a build with a schedule trigger that drops the target overnight and restores it in the morning. In Kotlin DSL:
Store warmAgents.token as a password-type parameter so the value stays masked in build logs.
And the trigger:
Add a second trigger with target=0 for the evening. See this repository for a complete sample.
The day-night split is the common case, but your workflow may call for a different shape. To see how demand actually fluctuates, the plugin exposes a small set of metrics:
With a multi-node setup, add an X-TeamCity-Node-Id-Cookie=<main-node-id> cookie to pin the request to the main node, which collects the metrics.
The plugin computes utilization and saturation metrics per configured cloud image, showing how busy your agents are and how well they keep up with the queue. Metrics come out in Prometheus format, so you can scrape them over time and see when demand peaks. A minimal Prometheus config is available here as an example.
Tell us what you think
We would love to hear how the feature works for you and what your use cases look like. Share your feedback in the comments section below or in the original feature request, and take a look at our plans for future improvements if you’re curious.