As AI-assisted development helps teams create and ship more code, engineers need to check a growing volume of changes under real production conditions. Even code that passes testing can introduce errors or slowdowns in production, so early detection is essential to protecting customers.
Automating those health checks helps teams keep pace by reducing the time engineers spend watching dashboards. By evaluating application and infrastructure health as changes reach production, teams can catch issues early and decide when a deployment is safe to continue.
Datadog Deployment Gates, now generally available, brings automated health checks into your existing deployment workflows, helping teams catch production issues early and pause deployments to limit customer impact. It combines Datadog’s broad range of application and infrastructure monitors with automatic detection of unexpected errors.
In this post, we’ll show how you can:
- Reduce production incidents with automated deployment checks
Reduce production incidents with automated deployment checks
- Spend less engineering time monitoring deployments
Spend less engineering time monitoring deployments
Reduce production incidents with automated deployment checks
A deployment can complete successfully even when the new version introduces errors or slowdowns. Checking its health under production traffic helps teams catch issues early and decide whether to proceed before more customers are affected.
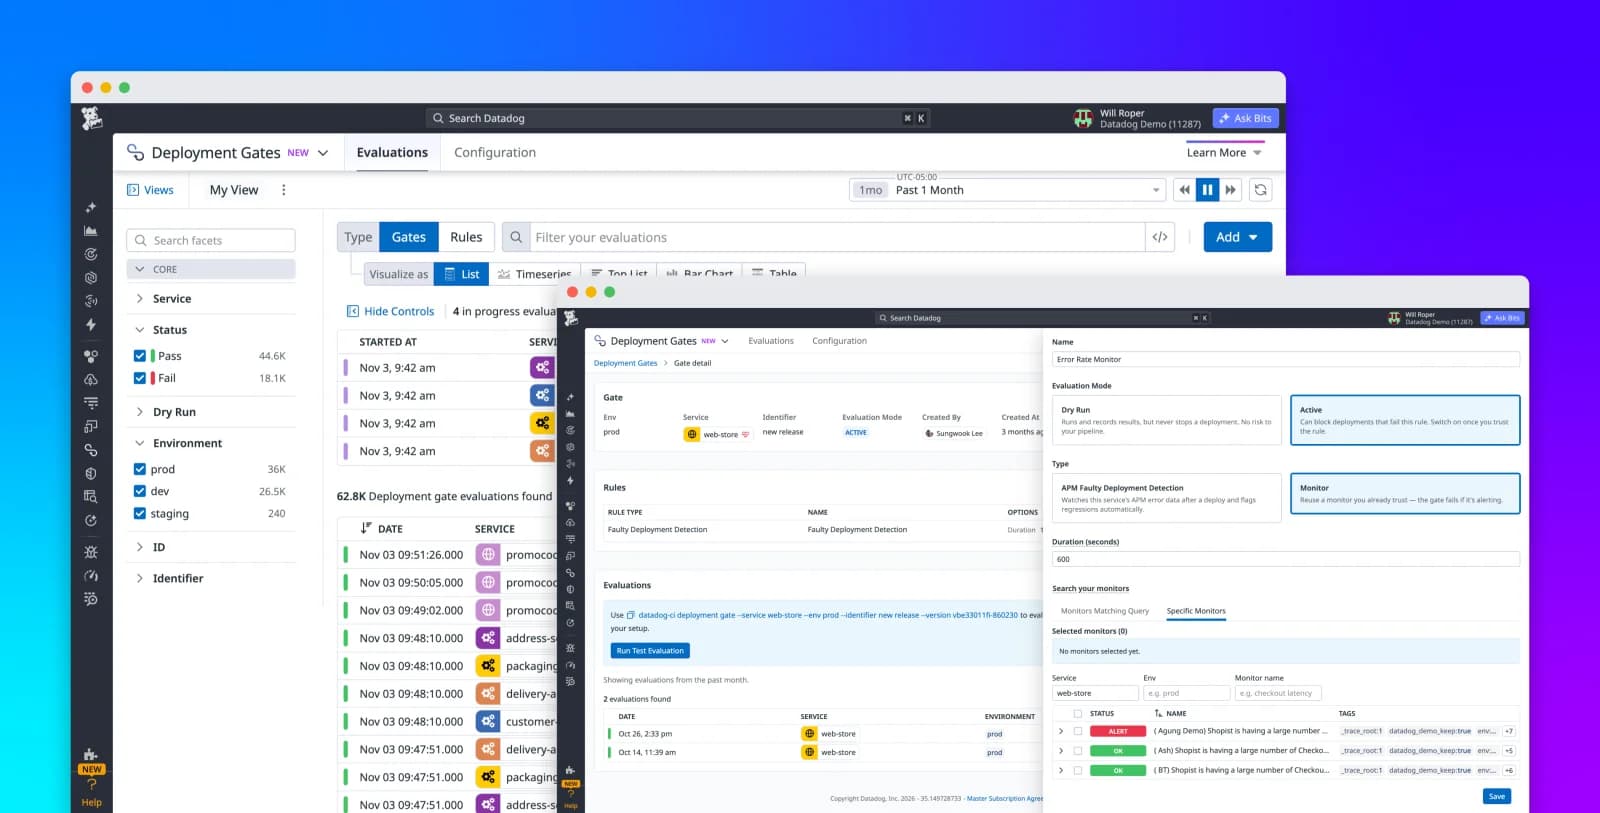
Deployment Gates helps you make that decision before deploying more broadly. A deployment gate acts as an automated checkpoint after a deployment or between deployment stages, evaluating production health before the workflow proceeds. For example, you can deploy a new application version to a small subset of your infrastructure and evaluate its health before expanding. If a required check fails, the workflow can pause the deployment while the new version is still limited to that initial stage.
Deployment Gates combines monitor rules that check the health conditions your team defines with Watchdog™Faulty Deployment Detection, a capability of Datadog Application Performance Monitoring (APM) that flags errors your monitors aren’t set up to catch. Together, these checks help teams catch issues covered by configured monitors as well as errors they may not anticipate.
Reuse Datadog monitors to check deployment health
If you already use Datadog monitors to track error rates, request latency, or infrastructure resource utilization, Deployment Gates can use those same monitors to decide whether a deployment should proceed.
Monitor rules evaluate selected Datadog monitors over a defined period. For example, if application errors spike or performance slows during a deployment and a selected monitor detects the change, the rule can fail the gate before the deployment proceeds. Because rules draw on monitors your teams already maintain, you can tailor health checks to each service and deployment workflow.
Detect unexpected errors with Watchdog Faulty Deployment Detection
Some application errors fall outside the conditions your team has configured monitors to check. A code change might introduce an entirely new error type or increase errors at an endpoint that previously worked as expected. Deployment checks based only on predefined monitors can miss these issues.
Watchdog Faulty Deployment Detection uses Datadog’s AI engine for analyzing observability data across the platform, to find application errors your team may not have anticipated. For services instrumented with APM, Watchdog compares the deployed version with previous versions of the same service to identify new error types and significant error-rate increases at individual endpoints.
Consider a checkout service that passes testing but introduces a new error type during a canary deployment. By comparing service versions, Watchdog can detect the new error without a dedicated monitor and trigger the Watchdog Faulty Deployment Detection rule to fail the gate. The workflow then pauses the deployment while the new version is limited to the canary stage, giving engineers time to investigate before deploying it more broadly.
By combining monitor checks with automatic detection of unexpected application errors, Deployment Gates helps teams catch a broader range of production issues during deployments and limit customer impact.
Spend less engineering time monitoring deployments
Manually checking deployment health pulls engineers away from development as they review dashboards, assess application and infrastructure health, and intervene when problems appear. Deployment Gates automates those checks so engineers spend less time overseeing each deployment.
Deployment Gates puts health checks to work within your existing workflow: Active gates let the workflow continue when all required checks pass and pause when one fails. Engineers can then focus on investigating the issues gates surface, with the confidence that required health checks run as part of the deployment process.
You can add these checks to your existing deployment tools and workflows through GitHub Actions, Argo Rollouts, the datadog-ci command-line tool, or the Datadog API. Reuse shared rules across teams or tailor them to each service to fit the deployment process you already use.
Test Deployment Gates without interrupting deployments
Dry-run mode lets you try Deployment Gates in your existing workflow and see which deployments would pause and why, while deployments continue as usual.
Datadog checks live application and infrastructure signals from the deployed version and records the outcome of each check, including the reason for any failure. Reviewing these results helps you understand which production issues your gates catch and adjust checks to fit each service before turning on automatic pauses. Once you’re ready, switch to active mode so your workflow pauses when a required check fails, helping limit customer impact.
Investigate issues faster and keep deployments moving
When a gate fails, Datadog brings together the deployed version, failed check, and failure reason, providing access to the related monitor or APM finding. Engineers can follow the associated traces to see where requests fail or slow down.
Teams can continue the investigation with Bits Chat, asking it in natural language to explain the services involved, explore likely causes, and recommend next steps. With production data and guidance in one place, engineers can decide how to respond sooner.
Those failure details remain available in evaluation history, where teams can review recently completed gate evaluations and their failure reasons. By identifying frequently failing gates and rules, analyzing common failure patterns, and tracking evaluation trends over time, teams can prioritize fixes that reduce recurring deployment interruptions.
Get started with Deployment Gates
Datadog Deployment Gates combines application and infrastructure monitors with automatic detection of unexpected errors to help teams reduce production incidents as they deploy. By pausing deployments when required health checks fail and bringing failure details into Datadog, it helps teams limit customer impact, investigate issues faster, and get back to delivering new features with confidence.
To get started, see the Deployment Gates setup documentation to learn how to add health checks to your deployment workflows. You can also review the preconfigured gate options and Deployment Gates evaluation results to explore the available checks and investigation details.
If you’re not yet a Datadog customer, sign up for a free 14-day trial.