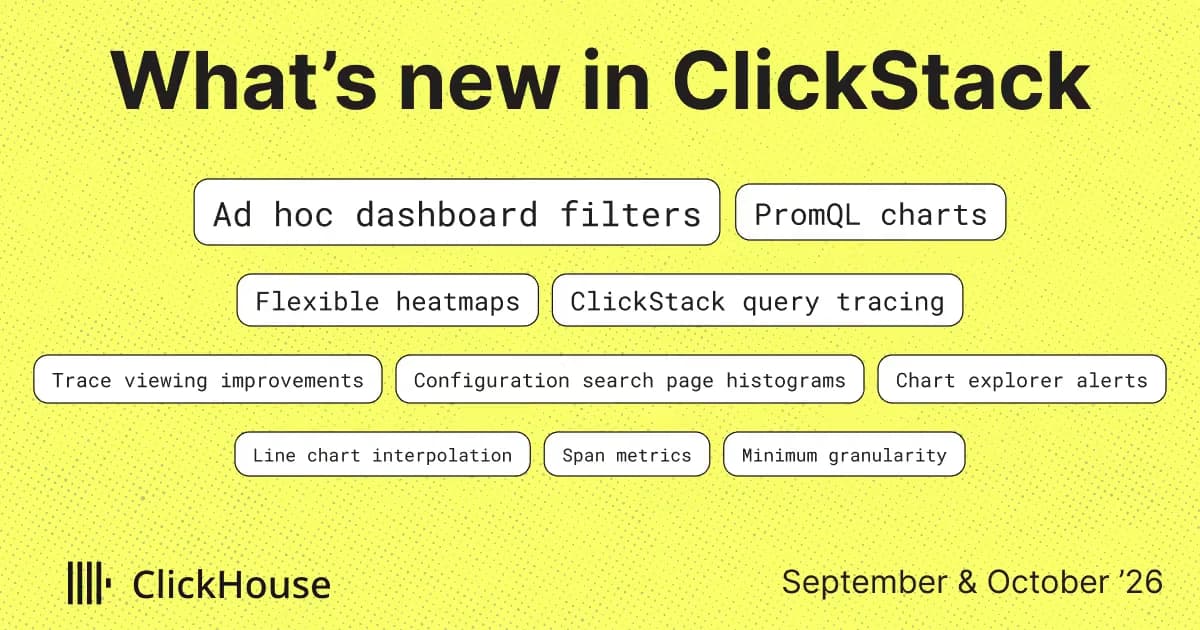
We've had a busy couple of months on ClickStack, with four minor releases and some exciting news we'll share soon. We've fallen a little behind on What's New, so this edition combines September and October, covering v2.39 through v2.42.
Dashboards gained ad hoc filters for more interactivity, single-select and required filters, saved relative time ranges, and variables in markdown tiles. PromQL, introduced in preview in August, now supports every chart type in the editor, including number tiles, tables, pie charts, and heatmaps. PromQL tiles are also supported through the external API for managing Prometheus dashboards as code, while heatmaps gained a series mode.
Every ClickStack query now includes its origin, helping you track read load on shared ClickHouse clusters. We've also added a Trace logs tab, aligned span panels with current OpenTelemetry conventions, and improved the search page with help from the community. Other additions include alert creation from the chart explorer, an MCP service health tool for faster agentic investigations, and StatsD and span metrics support in the collector.
If two months is too long to wait, our weekly Demo Day videos are a good way to keep up with the latest. The dev team shows what they're working on, so you can see what's taking shape before it reaches this newsletter. We also share the videos in the #o11y-clickstack channel on Slack.
We'll be at KubeCon in Salt Lake City next week. Join us at booth #108, or get hands-on withClickStack training on November 9. For drinks, request a spot at Gracie's on November 10 or AprèsKube at Keys on Main on November 11, with registration subject to approval.
We'll be at KubeCon in Salt Lake City next week. Join us at booth #108, or get hands-on withClickStack training on November 9. For drinks, request a spot at or , with registration subject to approval.
Thank you to our open source contributors and to the users whose feedback shaped many of these features.
Harshul1484, DevShoaib78, breken-ai, krishs01, BilalAtique, 28Hus, squaredg, archat-hash, octo47, wanjinhao1, felipe-carvalho12, adityareddy-dev, bahltushar, andrewdunndev, poblahblahblah, marcleblanc2
Contributing doesn't have to mean writing code. Documentation fixes, ideas, feature requests, bug reports, and general feedback are all welcome through the repository. Small contributions count too, and each one improves ClickStack for the wider community.
Until now, dashboard filters had to be defined up front by the user. Whoever built the dashboard chose a column, and everyone else got a dropdown for it. But during an investigation, you might spot a host, status code, or customer ID you want to filter by that the dashboard author hadn't anticipated. That meant editing individual tiles or adding another dashboard filter.
The new Ad hoc keys and values filter type lets you choose which fields to filter as you investigate. It supports columns and map keys for log, trace, and metric sources, and label names for PromQL sources.
Pick a key, an operator, and a value from the filter bar, with suggestions for both keys and values. The condition then applies to every tile using those sources.
These filters also unlock greater dashboard interactivity, allowing users to add conditions directly from visualizations. Click a cell in a search tile, a group-by cell in a table tile, or a series in a time chart tooltip to filter by that value. For raw SQL tiles, ClickStack uses the query's GROUP BY clause to identify columns available for click-to-filter. If it can't parse the query, it offers the string columns instead. If errors are up for a particular service, you can filter to that service, then narrow further by region without editing any tiles. The SQL and PromQL previews show the conditions applied to each query.
Conditions support equality, negation, regular expression matches, and LIKE for SQL sources. Selections are stored in the dashboard URL, so you can share a filtered view or save them as dashboard defaults alongside your existing filters. When you import a dashboard, its ad hoc filters are remapped to your sources, just like its tiles.
For now Ad-hoc filters are experimental. Enable with the environmental variable NEXT_PUBLIC_ENABLE_ADHOC_FILTERS=true while we gather feedback.
For now Ad-hoc filters are experimental. Enable with the environmental variable NEXT_PUBLIC_ENABLE_ADHOC_FILTERS=true while we gather feedback.
When we introduced PromQL support in August, you could use a single PromQL expression in a time series chart. We've since expanded the chart editor to support more of the chart types and query options teams need when bringing their Prometheus dashboards to ClickStack.
Time series charts now support multiple PromQL expressions, each with its own alias. You can plot p50, p95, and p99 latency together, for example. The query preview below the editor shows each expression with dashboard variables substituted.
Number tiles will feel familiar if you've used Grafana stat panels. Choose an Instant query to evaluate the expression once at the end of the time range, or a Range query to reduce the results to a single value using Last, Min, Max, Avg, Sum, or Count. Range queries can also display a sparkline behind the number. If your expression still returns more than one value, the tile warns you.
PromQL also works with tables, pie charts, and bar charts. Tables show each returned sample as a row, with a column for each label. Pie and bar charts support the same instant and range query options as number tiles, along with legend templates.
You can use three Grafana-compatible macros in your expressions: $__interval for the chart's granularity, $__range for the selected time range's duration, and $__rate_interval for a window covering several scrape intervals. All three appear in autocomplete suggestions and are substituted in the query preview, just like dashboard variables.
For queries that return hundreds of series, Series Limit in the display settings helps keep charts readable. Line and stacked bar charts retain the top series by peak value, while pie and bar charts keep the largest slices or bars.
PromQL support remains experimental. Enable it with ENABLE_PROMQL=true on the API and NEXT_PUBLIC_ENABLE_PROMQL=true on the app.
PromQL support remains experimental. Enable it with ENABLE_PROMQL=true on the API and NEXT_PUBLIC_ENABLE_PROMQL=true on the app.
We've also made improvements to the dashboard variables introduced in August, based on user feedback.
Filters can now be marked as single-select, so choosing a new value replaces the current selection. This is particularly useful for PromQL, where multi-select variables expand to regular expression alternations and would require the =~ matcher.
Single-select variables work with plain equality, such as instance="$instance". The new PromQL variable format, used by default in PromQL expressions, handles escaping for both single-select and multi-select values.
You can also mark filters as Required. Previously, opening a dashboard would run every tile before you'd selected any filters, potentially querying a lot of data you weren't interested in.
Tiles that use a required filter now wait until you've selected a value. You can also extend this requirement to every tile on the dashboard. When editing a tile, the preview uses your current dashboard filter selections, with an Apply filters toggle to compare the filtered and unfiltered results.
Dashboards now remember relative time ranges too. Save a dashboard with "last 6 hours" selected, and it will open on the last 6 hours each time, rather than the fixed dates shown when you saved it.
Finally, markdown tiles now support dashboard variables, including in links. You can use them to show which service or environment you're viewing, or pass the current selection to another page through a link. Values are escaped for Markdown by default, with ${var:csv} and other formats available when you need a different representation.
Heatmaps in ClickStack previously showed numeric distributions, with a bucketed value such as span duration on the y-axis and color indicating the number of events in each bucket. This works well for understanding latency, but doesn't let you use the visual for broader behavioral investigations.
The new Series mode gives each group-by value its own row, with time buckets remaining along the x-axis and color representing your chosen aggregate. You can use it much like a multi-series line chart, with color showing the values instead of line height.
For PromQL sources, heatmaps support three modes. Series works as described above using a range query, with support for macros, variables, and legend templates. Histogram works with metrics that Prometheus has already bucketed. Bucket bounds come from the le labels, and you can use sum by (le) (...) to combine series that share those bounds.
Distribution groups sample values from all series into buckets at each timestamp, using either linear or logarithmic spacing. This is useful for data that isn't already a histogram, such as CPU utilization across cores.
When a group-by returns more than 50 series, the heatmap displays the top 50 and shows a warning. It uses the same ranking as time charts.
The external dashboards API now supports PromQL tiles. GET /api/v2/dashboards includes them in responses, and POST and PUT accept them using configType: "promql", a sourceId, and a list of expressions. Previously, PromQL tiles were omitted from responses, meaning they could be lost when saving a dashboard back through the API.
You can now manage dashboards containing PromQL tiles through the API or Terraform, just like other dashboards.
We've also added PromQL source detection to onboarding. When PromQL is enabled, ClickStack automatically creates a source for any ClickHouse TimeSeries table it detects on the connection, alongside the log, trace, and metric sources detected from OpenTelemetry tables.
Under the hood, PromQL queries now use ClickHouse's Prometheus HTTP API where the server supports it. ClickHouse maintains forward compatibility for this interface while the TimeSeries engine is in preview. PromQL tiles and the /api/v1/prometheus/* routes now use sourceId in place of connectionId, resolving the connection through the source.
The bundled ClickHouse images move to 26.8. If you run PromQL against a ClickHouse server of your own, we recommend 26.8 or newer.
The bundled ClickHouse images move to 26.8. If you run PromQL against a ClickHouse server of your own, we recommend 26.8 or newer.
Many ClickStack deployments share a ClickHouse cluster with other workloads. Until now, a heavy query in system.query_log told you it came from ClickStack and nothing more, so tracking read load back to a dashboard or an alert meant matching SQL text by hand.
To address this, every query ClickStack runs now carries a small JSON log_comment naming the surface that issued it, along with the IDs that pin it down: the dashboard and tile, the saved search, the alert, the MCP tool, or the chart explorer. Its query_id starts with hdx- and the surface name, so a query can be recognized in system.processes while it is still running, with no JSON parsing needed.
The comment records what was asked for, never who asked, so no user or team identifiers are written.
The comment records what was asked for, never who asked, so no user or team identifiers are written.
The following query allows users to quickly identify where the load for a ClickStack service is originating:
You can even run this in ClickStack itself to see what's happening under the hood. A little observability for your observability:
PromQL queries include the same attribution, whether they run through ClickHouse's Prometheus API or table functions, so you can track their load alongside your other dashboards. Beyond cost tracking, this lets you trace a slow query back to the tile that generated it. It also lays the groundwork for query recommendations we're thinking of building.
We've made three improvements to reading traces in the side panel. All three work with traces you've already collected.
Previously, finding trace logs meant looking through the spans in the waterfall, which could get crowded for traces with many logs. The event side panel now has a Trace logs tab that displays logs in a flat, chronological table with the same pagination, sorting, and expandable JSON as the search page.
The tab appears for any span or log with a trace ID and an associated log source. Select a log to inspect it in the panel, or use Open in search to continue filtering on the search page with the same source, trace, and time window. We've also added the trace's total duration and span count to the waterfall's controls bar, so you can see both without working them out from the timeline.
OpenTelemetry SDKs can record exceptions as logs with exception.* attributes as well as span events. The Exception panel now appears for any log or span carrying exception.type, exception.message, or exception.stacktrace. The waterfall also highlights error logs and exception events in red, making them easier to spot.
Default trace sources now load span events and links automatically, so span exceptions appear without any manual source configuration.
We've invested time in the search page over the last two months, and so has the community. Several of the improvements below came from community contributions, which we're hugely grateful for. Thanks to everyone who's sent a PR, flagged something frustrating, or told us what would make their day a little easier.
Spotted a spike in the search histogram and wondered which service was responsible? Previously, you'd have to build a chart elsewhere to find out. Now, the histogram's Group by control lets you break down the volume by a field. Pick one from the same key list as the filter sidebar, or enter a SQL expression. Compatible group-bys stay selected when you switch sources.
Sometimes you just need a few log lines to share with a colleague. You can now select individual rows using checkboxes, or Shift-click to select a range, then choose Download CSV, Copy as CSV, or Copy as JSON. The export includes only your selected rows and the columns currently shown.
Checkboxes appear on hover and stay visible once you've selected something.
If you've added MATERIALIZED or ALIAS columns to a table, you might have noticed they were missing from row details. The panel fetches rows with SELECT *, which excludes those columns. You can now include them by enabling Show materialized and alias columns in the Column Values view options menu. For now, we leave this off by default.
The same menu now lets you choose Property order: A-Z, Z-A, or original order. That last option is handy when you'd rather preserve the key order in a Map column or the JSON body.
We also had some feedback that some users prefer rows to expand inline instead of opening the side panel. You can now set Preferences → Search results → Row click to Expand inline, making the whole row clickable instead of just the small chevron. You can still open the side panel using the button that appears on hover.
With recent changes, hopefully finding a key in a long list of attributes should be a little less tedious now. Map groups such as LogAttributes and ResourceAttributes have their own key search, much like the value search on regular filters. Each Map column also gets its own key fetch limit, so hundreds of log attributes won't push ResourceAttributes out of the sidebar.
We've also stopped making the whole sidebar wait for its slowest query. Filter values appear as each query finishes. Over longer time ranges, you'll see keys first and values filling in as they arrive, so you can start filtering while the rest load.
We've kept investing in alerting based on what you need and ask for, so please keep the feedback coming.
Want an alert without creating a dashboard tile you'll never look at? Previously, every alert needed a saved search for logs or a dashboard tile for metrics. That's a lot of extra housekeeping if you're bringing over a thousand Grafana rules.
You can now build a chart in the explorer using logs, traces, or metrics, with either the query builder or raw SQL, and add an alert directly. The alert stores its own chart configuration and appears on the alerts page with a chart icon. Follow its link back to the explorer, and the query is ready for you to inspect or edit.
Grouped alerts can now tell you which group needs attention. Use {{var.<column>}} to include the breaching group's value for any group-by column. For example, {"summary": "{{var.ServiceName}} has an elevated error rate"} names the service in each notification. Those values are included in resolve notifications too.
Alert tags are also available through {{tags}}. This came from a user who needed to route alerts to the right team through a shared incident.io webhook.
We've also added a few ways to catch template mistakes before an alert needs to fire. Errors appear in the webhook editor as you type, and the API rejects bodies that don't compile. For automated workflows, POST /api/v2/webhooks/validate checks a webhook configuration without saving it, handy during a Terraform plan. The editor also lists every available variable with a description, and Send test populates them with sample values.
We've been putting the ClickStack MCP server through its paces in production and our evaluation suite. Watching where agents get stuck, or take the long way round, has given us plenty to work on.
"How are my services doing?" sounds like a simple question. Previously, answering it took an agent several calls to fetch tables and time series and then piece the results together.
The new clickstack_service_health tool returns throughput, error rate, latency percentiles, and top error groups for every service in one call. It compares results with the same window yesterday and highlights unhealthy services and new or growing errors. In our service-health-check evaluation, agents scored higher while using about half as many tool calls.
We'll keep investing in tools that help agents get investigations off to a good start, wasting fewer tokens gathering context and making investigations more consistent and efficient, with the aim of resolving issues faster.
We've also filled in a few details that help MCP clients work with the server. Every tool now declares all four behavior hints: whether it's read-only, destructive, idempotent, and open-world. Clients use these hints when deciding which calls need approval, and some compatibility checks require all four.
The server now includes a title, description, website, and icon in its initialize response too, so MCP directories and clients have the details they need when listing it.
If your application already uses StatsD to count failed payments, track queue sizes, or measure how long a job takes, you shouldn't have to rewrite that instrumentation to use ClickStack. The ClickStack collector now includes a StatsD receiver, so you can send those metrics straight to it. It also understands DogStatsD tags, making this useful for applications currently sending custom metrics to Datadog.
We've also added a span metrics connector for a different but related job: turning traces into metrics. Traces describe individual requests, but you often want an overview of how many requests a service handles, how many fail, and how long they take. The connector generates call counts and latency histograms from incoming spans, including traces from the Datadog Agent, so you can build those views without adding separate metrics instrumentation.
Together, these additions let you bring existing application metrics into ClickStack and generate service metrics from the traces you're already collecting. For teams moving from Datadog, that means less instrumentation work up front and more room to migrate gradually. You can compare metrics across both systems and rebuild dashboards before switching anything off.
Both components are opt-in and configured through a custom pipeline using CUSTOM_OTELCOL_CONFIG_FILE. The span metrics connector emits traces.span.metrics.calls and traces.span.metrics.duration, with support for exponential histograms that ClickStack stores natively.
Want to see the total and which services contribute most, without adding up the lines yourself? Time series tiles now support a stacked line display alongside stacked bars. Each series has a filled area, stacked on the others, so you can see both the overall trend and the individual contributions.
You can also choose how lines connect between points with the line interpolation setting: smooth, linear, or step. Step is handy for values that change in discrete jumps, such as the number of running replicas. The setting is available in the app, the external API, and the MCP server.
The Terraform export previously skipped alerts that weren't attached to a saved search. Dashboard tile alerts are now included, using the source \= "tile" form added in version 3.28.0 of the ClickHouse Terraform provider.
Dashboard tiles can now have a description explaining what they show or how to read them. Set it next to the chart name in the tile editor, and it appears as an info tooltip beside the tile title. Descriptions are also supported through the external API.
When you zoom into a chart, auto-granularity may choose buckets smaller than the metric's scrape interval. A metric collected once a minute might appear in 30-second buckets, leaving every other bucket empty and making the chart look like data is missing. To avoid this, you can now set Minimum auto granularity under Team Settings → Sources to keep automatic buckets at least as wide as your scrape interval. Tiles with an explicit granularity are unaffected.
PromQL sources also have a Minimum auto granularity setting to prevent short time ranges from producing buckets finer than your scrape interval. This value is also used to calculate $__rate_interval, which otherwise assumes a 15-second scrape interval.
The Use UTC time switch in User Preferences is now a time zone picker, with Local and UTC pinned at the top and all browser-supported zones below. The sidebar badge and timestamp column headers show your selected zone.
Running several ClickStack instances, perhaps one per region? Set NEXT_PUBLIC_INSTANCE_LABEL to a short label such as "UK". It appears in the browser tab title and sidebar, making it easier to find the right instance in a sea of tabs.
You can now set the cap on /api/v2/* requests with EXTERNAL_API_RATE_LIMIT_MAX, giving busy integrations or export jobs more room. The default remains 100 requests per minute.
Metric names now stream from the table's primary index instead of waiting for an aggregation over the data. On sources with thousands of metrics, the first options appear in tens of milliseconds. Typing searches exhaustively, so you can still find any metric the index leaves out.
Number, bar, pie, table, and heatmap tiles now keep their previous data visible and pulse while refreshing, just as time charts already did. You can see when an update is still in progress without losing the current results. Thanks to the community for this contribution.
Live tail now supports 3h and 6h presets, up from the previous one-hour limit. Longer ranges remain disabled, with an explanation in the picker: each refresh re-queries the whole window.
The alerts page now loads one page at a time with server-side filtering, rather than fetching every alert into the browser. Teams with thousands of alerts can filter by state, name, and tags without slowing the page down.
That's it for September and October. Give the new features a try and let us know how you get on.
One thing to check before upgrading a self-hosted deployment: if authentication is enabled, you must now set EXPRESS_SESSION_SECRET explicitly. The API no longer falls back to a public default.
Get started today
Interested in seeing how ClickHouse works on your data? Get started with ClickHouse Cloud in minutes and receive $300 in free credits.