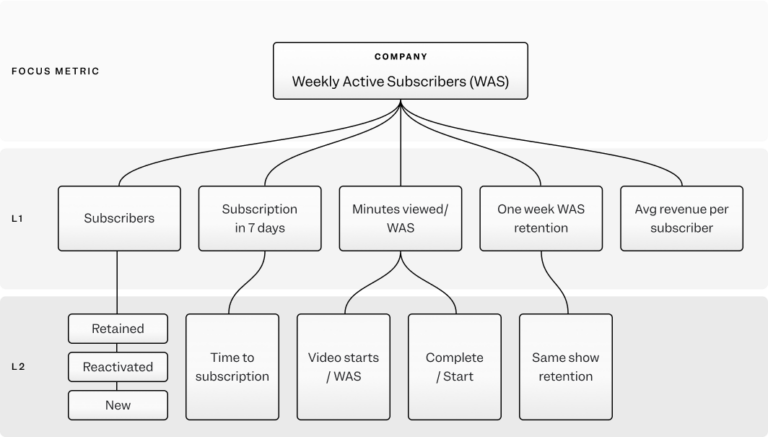
A metric tree is a logical hierarchy of your growth model. It reflects the relationships between individual metrics: from low-level indicators such as campaign performance or feature engagement to your main metric (North Star metric) that defines the focus of your business strategy.
The North Star metric has served as a cornerstone for many product teams for years, providing a clear benchmark for success. It helps align efforts around a single key metric, connecting day-to-day work with overall business outcomes and driving sustainable growth.
By defining a key metric that reflects customer value and linking it to key input metrics, product managers get a powerful tool for assessing the health and trajectory of their product. Nevertheless, even with a North Star benchmark in place, product teams often face challenges.
Although the North Star framework helps set strategic direction by showing where you want to go (the North Star metric) and outlining the main paths (key input metrics), it often leaves an important gap in operational execution. It answers the “what” and the high-level “why,” but does not always detail the “how.” This is where metric trees come in.
What is a metric tree?
A metric tree is a logical hierarchy of your growth model. It reflects the relationships between individual metrics: from low-level indicators such as campaign performance or feature engagement (also called input metrics) to your main North Star metric, which defines the focus of your business strategy.
The analytics community is showing increasing interest in the concept of detailed metric hierarchies for organizational alignment, as vividly illustrated by talks such as Abhi Sivasailam’s influential presentation at Data Council. The main idea of this presentation is that product owners need more reliable evidence of how their decisions drive growth. A metric tree provides clarity on how to obtain such evidence.
A business consists of small, measurable events, each of which affects the bigger picture: a marketing campaign, a feature release, a quickly resolved support ticket, or a customer renewing an annual subscription.
These small actions are often tracked as metrics at the level of an individual employee or team, rather than the entire organization. Input metrics indirectly affect the overall health and growth of the business, but it can be difficult to see the big picture when you are looking at only a small part of the whole.
On the other hand, North Star metrics (also known as focal metrics) provide more information about overall performance and business health, but they are often lagging indicators. Reporting on focal metrics gives valuable insight into what happened, but without linking them to input metrics, it is difficult to understand in detail why it happened or to use that information for decision-making.
A metric tree lets you see the full picture. By connecting focal and input metrics and understanding the relationships between them, you can recognize exactly which events led to the changes shown at the very top.
💡Useful tip: learn how to implement your growth strategy with Mixpanel metric trees!
North Star is your compass, and the metric tree is your map
In the North Star concept, where the main metric sits at the top, key input metrics (L1/L2 metrics) serve as the main paths to achieving it. This is a high-level guiding principle.
Think of a metric tree as a detailed map. When you know where you are heading, the map shows all the streets, turns, and specific landmarks that make up those paths. By making these connections explicit, metric trees help teams not only understand what exactly needs to be done, but also how all the components fit together to achieve that all-important North Star metric, turning strategic intentions into practical, measurable results.
Example: Revenue for period X
For example, if your focal metric is “Revenue for period X,” the metric tree will break this indicator down into components: “Number of users” multiplied by “average revenue per user.” An increase in the number of users or average revenue per user (and ideally both) will lead to higher revenue. The metric tree makes these connections more visible.
Why product teams need metric trees
Metric trees serve as a bridge between strategy and execution within an existing North Star framework. They allow every team member to understand how their actions affect the organization’s overall goals, and in the event of an unexpected change in focal metrics, they help managers and executives see at a detailed level exactly which steps led to those changes. If revenue is falling or churn is rising, it is critical to understand why.
Back to the “Revenue for period X” example
Let’s return to the focal metric “Revenue for period X” from the previous section. If this indicator is showing a downward trend, is it because:
- The number of users is declining?
- Average revenue per user is decreasing, or are both happening?
The answers to these questions will determine the next steps. Metric trees help you understand what is happening faster, and real-time decision-making turns tasks that used to take long meetings into insights available in minutes. Thanks to the structured approach of metric trees, teams can quickly move from high-level KPIs to specific user behavior scenarios, eliminating the delays that traditionally slow down product development cycles.
When you have a complete understanding of how each decision will affect all related metrics (all the way up to the North Star), it removes the need to guess when choosing priorities and direction. Metric trees also prevent optimizing one area at the expense of another, allowing for smarter trade-offs. Marketing teams now see how their campaigns affect in-product decisions. Product teams understand how feature releases impact support tickets. All elements are connected, and everyone operates according to a single scenario.
Components of a metric tree
Some companies build one comprehensive metric tree for the entire organization. Others start small and create metric trees for individual teams. In any case, a metric tree can be divided into several key elements:
1. North Star metric or focal metric
Defining the focal metric is the first step to creating an effective metric tree. It sits at the top of your metric tree and is most strongly tied to business outcomes. As a rule, it correlates with indicators such as revenue, growth, or user satisfaction.
To identify your focal metric, ask yourself: “What actions does my company (or my team, in the case of smaller trees) expect from users?”
Answers to this question become a focus metric after they are translated into usage-oriented and time-bound measurements. For example, an online store might use 'active buyers per week' as a focus metric, since it is related to both purchase frequency and revenue.
2. Input metrics L1, L2, L3
Input metrics form the foundation of a successful metric tree strategy. They connect your daily work and detailed actions to the focus metric.
- L1 input metrics influence the key metric.
- L2 metrics feed into L1 metrics.
- L3 metrics (not shown here) will be linked to L2 metrics, and so on.
Every action taken that can be linked to a measurable outcome should have a metric measuring its success.
To help you identify input metrics, ask yourself: 'What are the drivers of our key metric that my specific team or function controls?' You will likely get several answers. Each of them should be converted into usage-oriented, time-bound measurements.
When one input metric drives another, it should be placed below it at a sublevel (i.e., a level 2 input metric drives a level 1 input metric). For an e-commerce company, a level 2 input metric could be new and existing active users, while the L1 metric could be active users over three months.
How metrics are related
Metrics in a metric tree can have two types of relationships: component relationships or influence relationships.
In component relationships, metrics have a direct and quantifiable impact on one another. Component relationships are constant. For example, 'revenue over time period X' has a mathematical connection to its components: 'number of users' and 'average revenue per user.' You can calculate how these numbers will change using a formula.
The second type is influence relationships. These are metrics that correlate but do not have the same quantifiable connection. For example, lead response time often positively correlates with conversion rate. But no formula guarantees that increasing response time by X will improve conversion by Y. There is a correlation, but no measurable causal relationship.
Avoiding vanity metrics
Vanity metrics look good on paper, but they don't actually measure any tangible business outcomes. They often create a false sense of success and hide real problems.
To help you spot vanity metrics, pay attention to:
- Lack of actionable insights: they don't tell you what to change.
- Quantity over quality: they prioritize volume over real engagement.
- Obstacle to decision-making: they provide an incomplete picture.
Example: a simple page view metric may not reflect valuable user behavior.
Turning data into action with metric trees
There are five key principles for effective metric tree work.
1. Democratize your tree's data and metrics in real time on a self-service platform
Everyone should have access to the data they need without technical barriers. Use a self-service analytics platform to democratize access to real-time data and make it easy for everyone to understand how their actions affect the overall metric tree. For example, a product manager should have the data and resources to correlate user engagement with feature release dates, and a marketer should be able to view overall churn metrics and drill down into performance for specific campaigns without switching between tools or asking the analytics team for help.
2. Assign an owner for each metric
Accountability is key to fast and responsible decision-making. Every number in your metric tree should have an assigned owner (whether an individual or a team) who understands what that metric affects and can make decisions when it changes. For example, the marketing team would own the campaign-specific marketing effectiveness metrics mentioned above.
3. Link metrics to experiments and other reports for deep analysis
Your metric tree is only as useful as the insights it provides. When a metric changes unexpectedly, affecting other 'branches' of the tree, teams should be able to explore reports, experimentation platforms, user feedback systems, and analytics tools to understand why that metric is moving and what they can do to fix it. Interconnected data and analytics platforms are key not only to monitoring your data, but also to analyzing it and using it for data-driven decision-making.
4. Maintain data governance and an action log for each metric to ensure trust and transparency.
Building trust in your metrics is essential for making fast and confident decisions. You need to be sure that your data is accurate, calculated consistently, and truly reflects user behavior. To do this, you should clearly document the definition of each metric, conduct regular data quality checks, and openly communicate any changes to your measurement methodology.
It is equally important to keep a record of actions taken based on metric insights. When your marketing team adjusts campaign messaging based on churn data, that action should be logged with its rationale, timing, and expected impact. This creates institutional memory that helps future team members understand why certain decisions were made and learn from past responses to similar metric changes.
5. Metrics should continue to evolve in line with changes in your product or business strategies
Finally, your measurement system should be flexible enough to adapt as your business grows and evolves. Event-based tracking schemes, such as metric trees, allow you to change your system over time as your organization expands into new regions or launches new products and features. The most effective teams regularly review their metric trees to retire metrics that no longer produce actionable results and add new ones that align with current strategic priorities.
Example metric tree: E-commerce
The company in this example sells clothing online. The product team wants to ensure a steady influx of customers, so their current goal is to increase that number. They work closely with growth and marketing teams to expand product reach. They want to attract people and optimize their on-site experience as much as possible to increase basket size and encourage repeat purchases.
The metric tree below clearly shows how L2 metrics influence L1 metrics, which in turn influence the key metric.
Below is a detailed analysis of the values that make up this metric tree.
Key metric: Weekly Active Buyers (WAB)
In this case, active means having made a purchase. Site visitors who merely browsed pages may return, but they are not included in the key metric because they do not yet bring value to the business.
Reach: Active users over three months
The reach metric also includes people who recently performed a search or viewed products. This gives product owners a good sense of those who may make a purchase in the near future. They split this metric into new and existing users, and among those, into reactivated and retained categories.
Activation: First purchase within seven days / user
This tracks only the cohort of new users and shows how many of them make a purchase within seven days of their first search or view. The sub-metric tracks the status of specific stages in the user journey, from arriving on the site to making a purchase.
Engagement: Purchased items / WAB
Multi-item purchases are a quick way to increase revenue for this retailer. If a buyer has already found what they like and entered their credit card details, adding items to the cart requires minimal additional effort.
Second- and third-level metrics (L2 and L3) describe specific stages of the purchase funnel in detail, helping the team identify problem areas. If the abandoned cart rate is high, the team understands that they need to focus on optimizing the final stages of the customer experience.
Retention: One-month customer retention
This metric reflects whether customers return to make another purchase the following month, which matches the buying habits of this company's customers. For faster feedback, the company tracks one-week retention of users who perform a search or browse the catalog.
Business-specific: Average purchase price
This metric measures the average price per purchased item. This company's goal is to offer low prices, so they aim to lower this metric while increasing overall basket size. A luxury goods retailer, by contrast, would need a higher average purchase price but would not expect a large number of items in a single receipt.
Frequently asked questions
- What is the difference between a metric tree and a KPI dashboard?
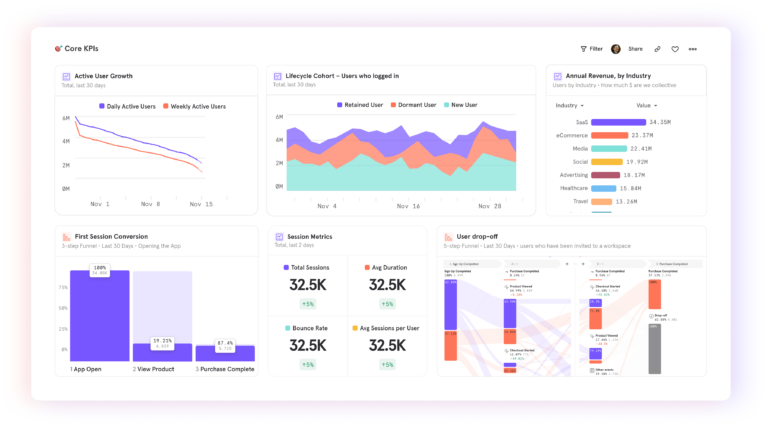
A metric tree is a hierarchical strategic structure for organizational alignment. It shows how small actions affect every level of your company up to your North Star metric. KPI dashboards provide an overview of a company's or team's key metrics. They are great for tracking performance but do not show how your metrics influence one another.
- How often should a metric tree be updated?
Goals and priorities change, and the metrics you track should change with them. We recommend reviewing your metric tree quarterly to remove metrics that no longer provide useful insights and add new ones that support your current strategy.
- What tools are needed to build a metric tree?
To build a metric tree, you will need a digital analytics platform that unifies your data into a single system.
- Can small product teams benefit from a metric tree?
Yes! Teams of any size can benefit from metric trees. Metric trees help ensure operational alignment and make it easier to prioritize actions that will have the greatest impact. Small teams with limited resources can use metric trees to gain leadership support, drive cross-team collaboration, and demonstrate the impact of product decisions. Contact us to get a demo of Mixpanel Mixpanel metric trees, or download our ebook to learn more.
Get a demo of Mixpanel metric trees.
Senior Product Marketing Manager at Mixpanel