Frontend and mobile applications depend on technical steps that users expect to work in every user journey: loading search results, signing in, saving a payment method, or processing a payment. Datadog Real User Monitoring (RUM) captures detailed events about these interactions, including views, actions, resources, and errors. But examining those events individually does not always provide a direct answer to more fundamental questions: Did a critical application step work, and how long did it take?
Operations Monitoring, included with RUM at no additional cost, gives teams a way to monitor application-controlled steps across real user traffic. An operation is a technical step that an application performs and that users expect to complete reliably. For example, “product checkout” can represent a broader user journey, while “enter payment details” and “process payment” are operations with measurable starts, outcomes, and durations. By defining operations, you can track their availability and latency independently while still understanding their roles in the broader user experience.
In this post, we’ll show you how to:
- Define and monitor critical operations in RUM
- Track operation health with service level objectives (SLOs)
- Investigate operation degradations with Bits AI
- Connect operations to journeys for end-to-end user experience monitoring
Define and monitor critical operations in RUM
A well-defined operation isolates application-controlled work so that you can measure its reliability without introducing unrelated user behavior. Consider an ecommerce checkout flow: A user might spend several minutes deciding whether to make a purchase, but when they click “Pay now,” the application needs to process that payment reliably and within an acceptable amount of time. You can define “process payment” as an operation that starts when the user submits the payment, succeeds when the application confirms that the payment is complete, and fails when the backend responds with an error status code.
Keeping these boundaries focused on application-controlled work helps make latency measurements more representative of application performance. If an operation includes time spent waiting for the user to read content or make a decision, its duration can increase even when the application is performing as expected. Similarly, each operation should have a recorded start and end. As a best practice, keep your timeout rate at or below 1% so that Datadog can classify at least 99% of started operations as successes or failures. For more guidance, see our best practices for setting up RUM operations.
Datadog provides several ways to define operations. If you have full control over your frontend code, you can use the RUM SDK APIs to customize when an operation starts, ends successfully, or ends in failure. You can also add custom attributes to provide additional context about each operation. If you don’t want to define operations in application code, you can use theDatadog MCP Server to create operations as part of an MCP-compatible workflow or use theRUM Operations API to create them programmatically or in bulk. You can also create operations in the Datadog UI by mapping existing RUM events to the conditions that mark when an operation starts, succeeds, or fails.
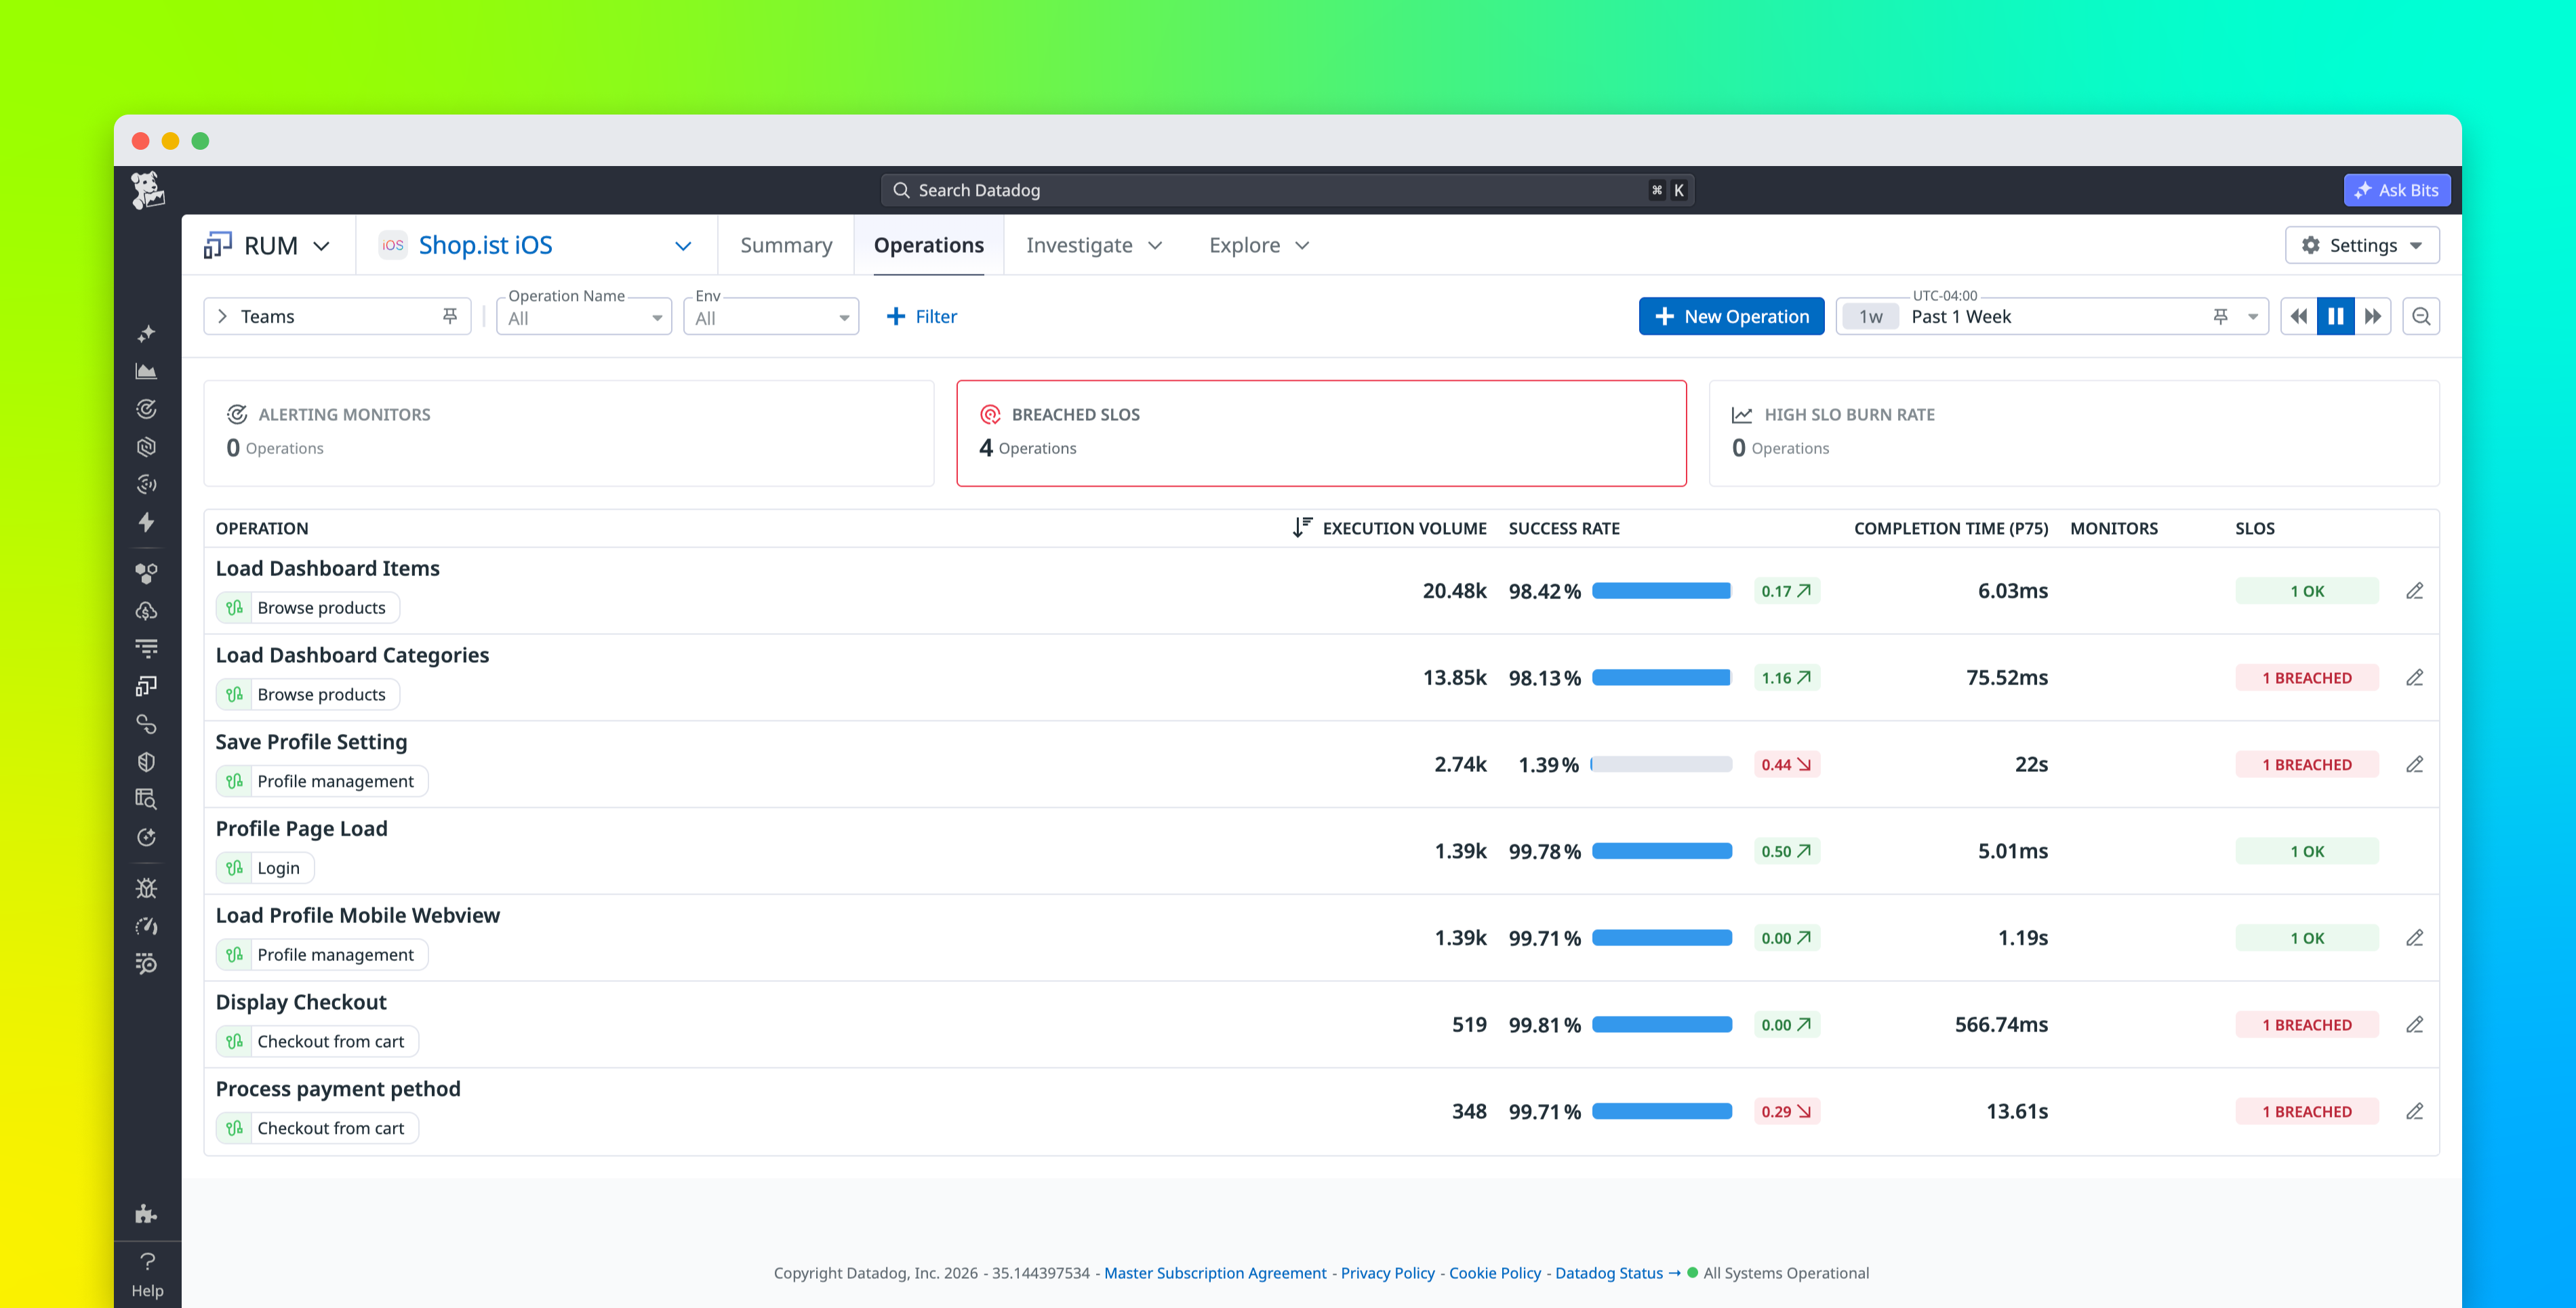
After you define an operation, Datadog groups occurrences with the same name in the operations catalog. In this central place, you can monitor important technical interactions independently of any broader journey. Datadog also generates out-of-the-box metrics from your full, ingested, unsampled RUM traffic: rum.measure.operation tracks operation volume, while rum.measure.operation.duration measures the time between an operation’s start and end. You can break down these signals by dimensions such as operation name, status, and failure reason.
Operation events also give you more control over which real user data you retain and investigate. For example, you can configure RUM retention filters to retain sessions in which a critical operation failed or exceeded an expected duration. You can then query operation events from retained RUM sessions in the RUM Explorer to inspect their attributes and surrounding session context.
Track operation health with SLOs
A checkout journey might not complete because a user changes their mind, but a “process payment” operation has a clearer technical outcome: The application either successfully processes the request, or it does not. As a result, operations are useful for setting reliability targets around the application behavior your team controls.
You can create separate SLOs for an operation’s availability and latency. An availability SLO measures whether the operation completes successfully, while a latency SLO measures whether it completes within your expected duration. Keeping these objectives separate helps you distinguish an operation that works consistently but is too slow from one that is fast when it works but fails too often.
For example, an ecommerce team can create an availability SLO for its “process payment” operation to measure the percentage of payment attempts that complete successfully. The team can separately create a latency SLO to measure whether successful payments complete within an expected performance threshold. Datadog’s best practices for creating SLOs for RUM operations include recommended queries and guidance for selecting appropriate targets.
Investigate operation degradations with Bits AI
SLOs and operation metrics tell you when an important interaction is unhealthy. The next question is why. Instead of manually moving among errors, sessions, resource waterfalls, traces, and other telemetry data, you can use Bits Investigation for Operations (currently in Preview) to analyze the signals associated with a degradation.
Bits investigates operation degradation such as errors, timeouts, abandonment, latency regressions, and sustained high latency. During an investigation, it analyzes relevant telemetry data to identify potential frontend, backend, and network causes. It then surfaces supporting evidence such as related errors, endpoints, code locations, sessions, and backend information.
Connect operations to journeys for end-to-end user experience monitoring
Operations are useful on their own, but some technical steps are also critical parts of a larger user workflow. Journey Monitoring lets you connect these two levels of the user experience. Engineering teams can continue monitoring each operation independently in the RUM Operations Monitoring experience while linking them to their related journey to understand how those technical steps relate to the broader workflow.
Linking is optional: An operation does not need to belong to a journey to provide useful availability, latency, and SLO signals. You can link an operation when you create it and later add or remove journey relationships as your monitoring evolves. When you create an operation from the journey details report, Datadog links the operation to that journey.
Explicitly linking operations to journeys establishes a relationship that extends beyond query-time correlation. Frequency-based correlation can be less useful for low-traffic or low-conversion journeys, and an important operation might become less visible because its execution volume drops during a problem. An explicit link identifies the operation as a critical part of the journey, regardless of traffic or execution volume.
When deciding which operations to associate with a journey, start with the technical steps that have the greatest effect on whether users can complete the journey. In particular, the final application-controlled step is important. For a checkout journey, this last step could be processing the payment after the user clicks “Pay now.” For login, it could be authenticating the user after they submit valid credentials. See the Journey Monitoring documentation to learn more about configuring journeys and working with linked operations.
Start monitoring the technical steps behind critical user experiences
RUM operations give engineering teams a dedicated way to measure the availability and latency of the application-controlled technical steps that underpin important user experiences. You can establish SLOs for those interactions, investigate degradations with Bits AI, and connect operations to Journey Monitoring when you need to understand their role in a broader user workflow. For more information, read the Operations Monitoring documentation and best practices for setting up RUM operations.
If you don’t already have a Datadog account, you can sign up for a 14-day free trial to get started with Operations Monitoring.