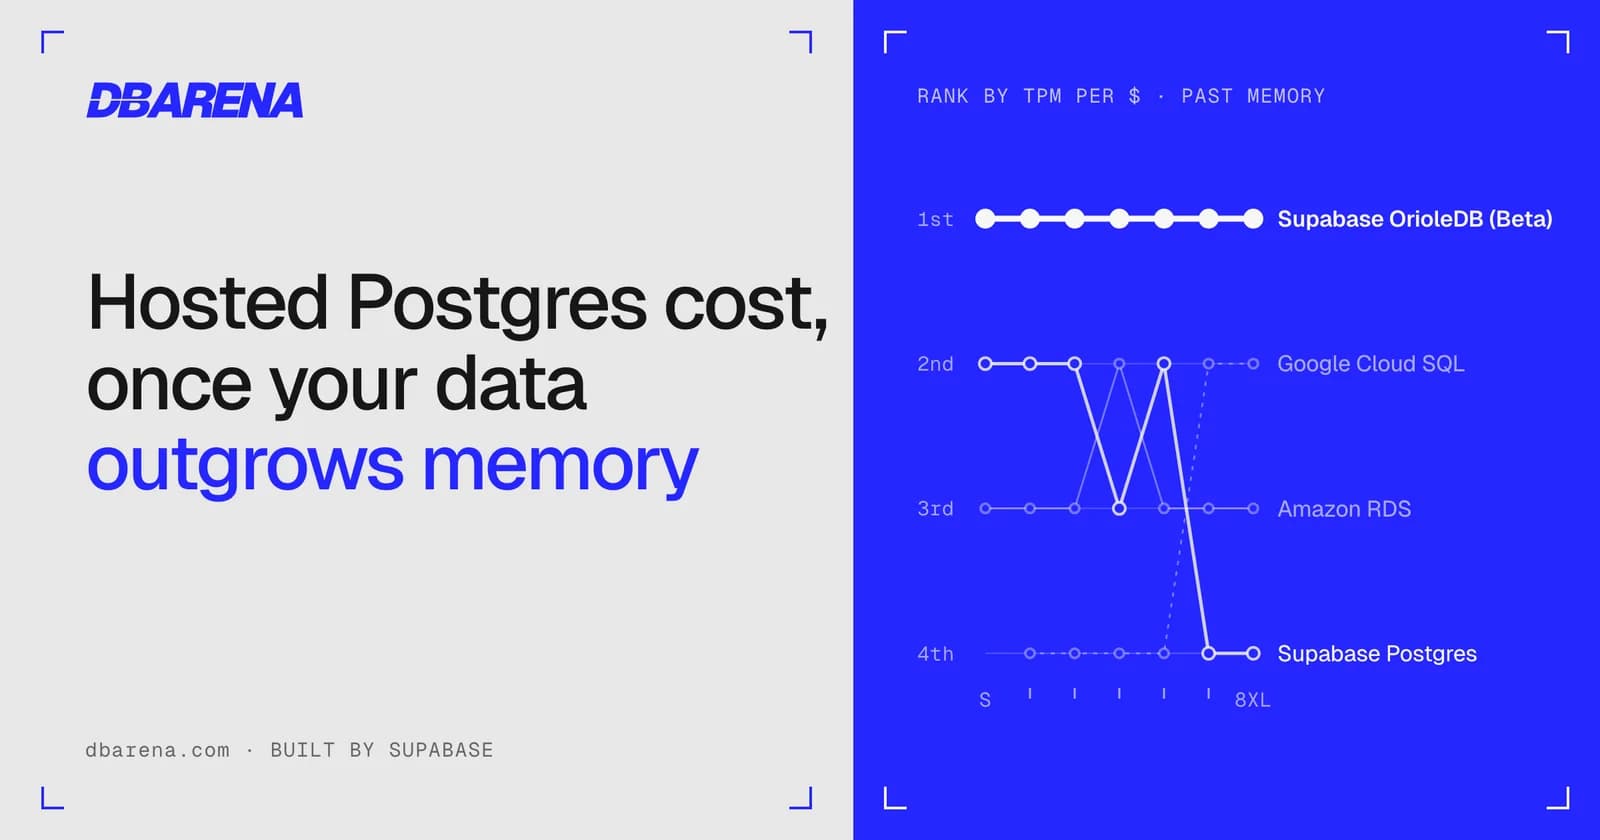
We're announcing DBArena, a site that publishes benchmarks of hosted Postgres providers. The first results compare Supabase Postgres (with default storage), Supabase Postgres (with OrioleDB), Amazon RDS, and Google Cloud SQL at up to seven compute sizes, measured on throughput, price-performance, and latency.
Supabase sponsors DBArena. The methodology is public, and all tools to run the benchmarks are open source. Each result includes a raw data file with the exact commands, configuration, and captured meta data, so you can rerun any test and compare your results with published ones.
Most published database benchmarks come from vendors and are difficult to compare with each other. They use different instance sizes, tuned configurations on one side and defaults on the other, and are hard to reproduce. Many report performance metrics without considering price, which hides the tradeoff teams care about.
On DBArena, every provider runs the same workload at matched vCPU counts and I/O configuration, and results are normalized for cost. Settings stay at each provider’s defaults.
The first release covers four products:
- Supabase Postgres with default heap storage
- Supabase Postgres with OrioleDB (beta)
- Amazon RDS for PostgreSQL
- Google Cloud SQL for PostgreSQL (Enterprise edition)
Each product is tested at up to seven compute tiers, from Small (2 vCPU, 2 GiB) to 8XLarge (32 vCPU, 128 GiB). Products are matched by vCPU count, and every test uses Postgres 17 with the provider's default configuration. Clients connect directly over TLS, without a connection pooler.
Each tier is tested in two scenarios:
- Cache fit: The data set fits in memory, with a buffer cache hit ratio of at least 99%.
- Cache exceeding: The data set is four times larger than available RAM, which forces reads from disk. Disk IOPS and throughput are matched across providers.
For every test point, DBArena reports three metrics:
- tpm: average transactions per minute over a 60-minute measurement run.
- tpm/$: transactions per minute per dollar of monthly cost, using public on-demand list prices with no discounts.
- p95 latency: the latency that 19 out of 20 transactions complete within.
The workload is derived from TPC-C, a standard benchmark that models an order-processing system. Think time is disabled, so the benchmark measures the maximum throughput each database can sustain.
This workload is derived from the TPC-C Benchmark and is not comparable to published TPC-C Benchmark results, as this implementation does not comply with all requirements of the TPC-C Benchmark.
For each test, DBArena provisions a fresh database and a load generator in the same region. It runs a 30-minute warmup that is discarded, followed by a 60-minute measurement. It sweeps the number of clients from one to six times (on the two largest tiers, up to eight times) the vCPU count to find each database's peak throughput. Each test repeats in a fresh environment until there are three successful runs, and the published result is the median run at peak concurrency.
The first round of results was measured between September 25 and October 1, 2026. It covers 62 published results drawn from more than 750 individual benchmark runs. These results went live on October 2, when we launched DBArena at Supabase Select.
Every published result has a result.json file in the dbarena.com repository under results/. It records the instance configuration that was provisioned, the price, the software versions, and the exact command used to run the test.
The benchmarks are run with three open source tools:
- dbarenactl schedules benchmark runs and tracks their progress.
- benchctl provisions environments and runs the workload.
- go-tpc is the load generator, a Supabase fork that fixes several issues in the upstream project.
To rerun a single test point against Amazon RDS, for example, set up dbarenactl and benchctl with an AWS account and run:
_10
dbarenactl run --candidate candidates/aws/rds/tpcc/manifest.yaml \
_10
--test-point xlarge/cache-exceeding \
_10
--iterations 3
Add --dry-run to the first command to preview what it will provision without creating anything.
The command prints a sweep ID. When the runs finish, fetch pricing data and export the results:
_10
dbarenactl pricing fetch --candidate candidates/aws/rds/tpcc/manifest.yaml
_10
dbarenactl results $SWEEP_ID
- One workload: All results come from a single workload derived from TPC-C.
- No think time: Because think time is disabled, the results show maximum throughput, not the behavior of a typical application with idle periods.
- One region per cloud: Tests run in AWS us-east-1 and GCP us-east1. They don't cover other regions, cross-region latency, or replicas.
- List prices: Costs use public on-demand list prices with no discounts.
- Matched by vCPU. Products are matched by vCPU count rather than memory, so providers with more RAM per vCPU have an advantage at some sizes.
- Load generator placement. For Amazon RDS and Google Cloud SQL, the load generator runs in the same availability zone as the database. Supabase doesn't support availability zone selection, so on Supabase it only runs in the same region.
The methodology page explains each of these choices in detail.
To get an email when new benchmarks are published, subscribe to the DBArena newsletter.