We’re seeing a new challenge emerge as AI-assisted software development becomes more common: autonomous agents can generate code, propose fixes, and even open pull requests, but they still need a reliable way to understand what’s happening in production.
That’s where observability becomes essential. As a launch partner for Cognition’s Devin Oncall experience, Dynatrace brings runtime intelligence from Dynatrace into autonomous software engineering workflows.
If you’re unfamiliar with Devin, it’s Cognition’s autonomous software engineer. Instead of helping complete code one prompt at a time, Devin can take on entire tasks, investigate problems, make changes, and open pull requests on your behalf. With Devin Oncall, Cognition is extending that same approach into incident response, enabling teams to investigate production issues and move from alert to resolution more efficiently.
But for an AI agent to be effective during an incident, it needs more than access to source code. It needs context. It needs to understand what changed, what’s failing, where impact is occurring, and whether a fix actually improved the situation. Most agents have to rebuild that context on every question, querying separate data stores and matching on tags and timestamps, which costs time, accuracy, and tokens.
That’s where Dynatrace comes in.
Connecting software delivery and production operations
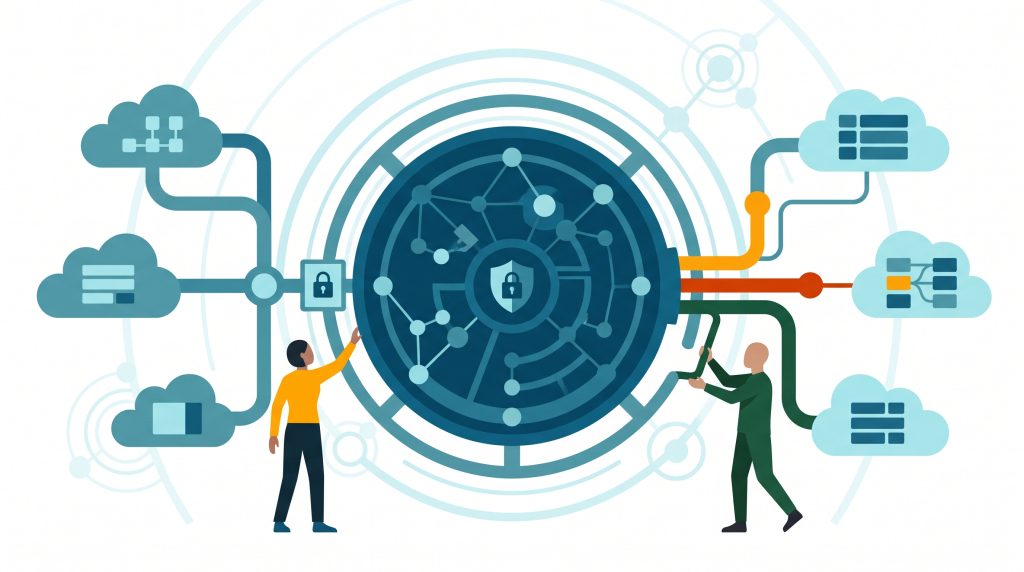
By connecting Devin to Dynatrace, teams can provide Devin access to Dynatrace problem and root-cause information, along with relevant logs, metrics, traces, deployment events, and runtime security findings, subject to the capabilities and permissions configured for the integration. Agents that query separate data stores may need to reconstruct context across sources, matching signals through tags and timestamps. That adds query and correlation overhead and can increase the time, tokens, and effort required to reach an accurate answer. With Dynatrace, that context is already built, so Devin can investigate issues using the same production data that developers, SREs, platform engineers, and operations teams already trust.
Together, Dynatrace and Cognition are helping bridge the gap between software delivery and production operations. Cognition provides the autonomous software engineer. Dynatrace provides the real-time production intelligence that helps that engineer understand what is happening in the environment and what to do next.
In the rest of this post, we’ll take a closer look at how the Dynatrace plugin works, what capabilities are included, and how teams can use Devin Oncall to investigate incidents, validate deployments, and assess runtime risk directly from their development workflow.
Giving Devin Oncall runtime context with Dynatrace
If you’ve worked with AI coding assistants, you’re probably familiar with the idea of getting help with a specific coding task. Devin takes that concept a step further. Instead of simply suggesting code, Devin can take ownership of an entire task, investigate problems, make changes, and open pull requests.
As we mentioned earlier, that level of autonomy creates a new challenge: understanding what’s happening in production. A code change might compile successfully, but did it actually resolve the issue? Is a deployment causing new failures? Is a vulnerable workload exposed in production?
That production context comes through the Dynatrace extension for Devin. The Dynatrace extension for Devin is available through the Devin Marketplace and is designed to connect Devin with a Dynatrace environment through an MCP server and Dynatrace skills.
What comes with the Dynatrace plugin?
The Dynatrace plugin contains two components. The first is the MCP server, which provides authenticated access to your Dynatrace environment. The second is a collection of Dynatrace skills that teach Devin how Dynatrace data is structured and how to interact with it effectively. For example, skills such as dt-dql-essentials help Devin understand Dynatrace Query Language (DQL) syntax and query patterns while dt-alerting provides guidance for working with anomaly detection and alerting workflows.
That combination is important: Giving an AI agent access to data without context often leads to ineffective queries, incomplete analysis, or higher token consumption. Giving it documentation without access to live data isn’t much better. The skills are designed to load when relevant to a task, helping preserve context-window capacity. Together, the MCP server and Dynatrace skills help Devin investigate issues using both real-time telemetry and platform-specific knowledge.
How do you connect Devin to Dynatrace?
Install the Dynatrace extension from Devin’s plugin marketplace and authenticate it using a Dynatrace platform token. Once connected, the Dynatrace skills are available to Devin according to the integration configuration.. The platform token is stored within your own installation credentials and isn’t written into the plugin manifest, helping keep access secure and manageable.
What happens when a production incident occurs?
When incidents happen, teams spend the first part of the investigation answering basic questions:
- What’s failing?
- How widespread is the impact?
- What changed?
- Where should we start looking?
Traditionally, answering those questions means switching between dashboards, logs, traces, alerting tools, and source code.
Imagine that checkout-api starts returning elevated 5xx errors:
- Ask Devin why checkout-api is failing, in plain language
- Devin pulls the affected problem, its root cause, and relevant logs, metrics, and traces from the affected entities
- You narrow the investigation to a specific service or impact area and ask what changed
- Make and validate a fix without leaving the same working session
Instead of starting with a dashboard and manually correlating signals, Devin begins with the cause, not the symptoms. Because the root cause comes from Dynatrace Intelligence, deterministic analysis over Smartscape, the live dependency graph of your environment, Devin starts with an answer instead of an investigation. An agent working from a guess can be allowed to recommend. An agent working from fact can be allowed to act. And because it uses the same Grail data your operations and SRE teams are already working from, everyone is working from a consistent source of truth. How can you validate a deployment with real production data?
Before deploying a change, you can ask Devin for the current failure rate, p99 latency, and resource headroom of the services involved. That creates a baseline on what’s actually happening in production.
Where the required deployment and telemetry data are available through the integration, Devin can use them to compare selected pre- and post-deployment signals and summarize the observed differences for review. The result is a data-driven view of whether the change improved reliability, performance, or efficiency, rather than relying on a quick dashboard check and a best guess.
How do you evaluate for vulnerabilities before opening a pull request?
Before opening a pull request, ask Devin whether a workload is exposed to a specific CVE. Dynatrace can add runtime context to vulnerability findings to help teams assess whether and how an affected workload is exposed in the running environment. Teams can use that runtime context as an input when prioritizing remediation before opening or merging a pull request.
The result is a more practical view of risk and better prioritization of remediation efforts.
Why this partnership is important for you
As agents take on more responsibility for running software, teams need a reliable way to verify their actions. Observability provides the production evidence to understand what a change actually did, whether an incident is resolved, and what remains exposed at runtime.
This is where Dynatrace sets Devin apart. Devin can use Dynatrace root-cause findings and correlated runtime context rather than relying only on independently retrieved signals. That production context helps Devin move from recommending a fix to acting on one with greater confidence, while giving teams the evidence to verify the outcome.
That’s the value Dynatrace brings to Devin Oncall: providing production context that can help agents investigate incidents and giving teams telemetry they can use to assess the effect of resulting changes.
To get started:
- Install the Dynatrace plugin once using Devin Oncall
- Connect your Dynatrace environment using a platform token
- Ask Devin to investigate a service, analyze a deployment, or assess runtime vulnerability exposure
- Experience how autonomous software engineering grounded in runtime context that is already built can help teams investigate and resolve issues faster
Dynatrace, Grail, and Smartscape are trademarks of the Dynatrace, Inc. group of companies. All other trademarks are the property of their respective owners.
Dynatrace, Grail, and Smartscape are trademarks of the Dynatrace, Inc. group of companies. All other trademarks are the property of their respective owners.