In this article, we highlight the real business value of observability: how much money a company loses each year to slow diagnosis, recurring failures, and poor capacity planning, and how much of that loss can be avoided. When companies weigh the cost of implementing observability against the losses it helps them avoid, the comparison points to a genuinely profitable investment in the vast majority of cases, not a spend on "nicer dashboards."
What is the difference between monitoring and observability?
Monitoring tells you something broke, based on a threshold set in advance: a fintech customer's payment failed to go through, the system couldn't pass a request to a partner, latency spiked on key requests. Almost every enterprise already has this, and it's still needed. The weak point is that monitoring only reacts to a problem that has already happened; it doesn't explain why payments are failing right now or why the partner integration has started dropping connections. Monitoring stays silent for failures nobody set a specific signal for in advance. And that's exactly where, in complex distributed systems, a large share of problem-resolution time gets lost.
Observability closes that gap. It correlates a wide range of information about the state of the system — from technical signals to business events like failed transactions or dropped calls to partners. So an engineer can ask an open-ended question, such as "Why are payments failing right now for one specific customer segment?", and get a path to the root cause instead of only checking dashboards built for questions anticipated in advance.
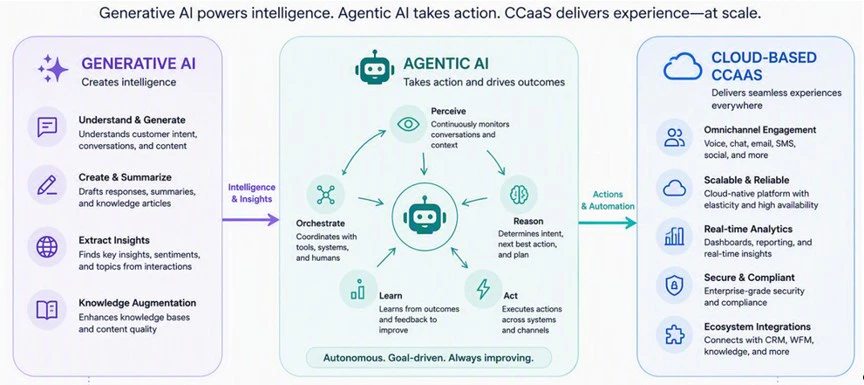
Layer artificial intelligence on top of that — automatic anomaly correlation, likely-cause suggestions, prioritising signals by business impact — and root-cause speed moves well beyond what observability alone delivers. This is where the difference between monitoring and observability is felt the most, and the numbers back it up.
Below are indicative ranges of impact across four areas, drawn from industry research. These aren't a guarantee for any individual company. They're a benchmark for building a business case. Actual results depend on the maturity of the company's current monitoring stack, the size of its environment, and the quality of implementation.
What unreliable systems actually cost
Reliability problems hit two different budget lines, and both come with real numbers attached.
Direct costs — the ones finance already tracks:
- Downtime itself. The time a company's service is unavailable to customers or unable to process transactions. According to Uptime Institute's 2025 analysis, most such outages cost at least $100,000, and severe incidents regularly exceed $1 million.
- SLA penalties. At 99.9% availability, a customer is owed credits for any outage beyond 43.8 minutes a month. At 99.99%, that threshold drops to 4.38 minutes. Every extra minute is a contractual cost, not just an inconvenience.
- Emergency fixes. Calling in contractors and paying overtime to hit a recovery deadline costs more than the same work done as planned maintenance.
Indirect costs — harder to price, but they compound over time:
- Renewal risk. Enterprise customers increasingly raise reliability in renewal negotiations, not just in support tickets.
- Attrition. Engineers stuck in constant firefighting leave more often. Replacing an experienced engineer typically costs 6–9 months of that person's salary in recruiting and ramp-up.
- Lost time on product development. Every hour spent on manual diagnosis is an hour not spent building what the business actually wants. Track it as the ratio of planned to unplanned work each sprint.
Direct costs alone are enough to justify the investment. Indirect costs are why the case gets stronger the longer you track it — burnout and attrition compound, while a single outage doesn't.
Where observability cuts maintenance spend
To put a dollar value on observability, a business needs to count not the fact that its dashboards look better, but the volume of losses it avoids. That sum comes from several sources:
- Shorter time spent analysing and resolving incidents.
- Prevention of repeat failures, consolidating existing monitoring tools into a single layer.
- Proactive alerts about a problem before customers feel it.
- Less time spent on the routine upkeep of the monitoring systems themselves.
Below is where each of these turns into concrete savings.
1. Getting to root cause faster
This is the simplest metric to measure: engineer-hours per incident. Correlated information about the state of the system removes the need to manually cross-check multiple dashboards to find where something broke. The MTTR improvement noted above, 25-30% for teams using AI-augmented observability, translates directly into fewer billable hours per incident. Multiplying that percentage by the organisation's current incident count and hourly engineering cost gives a reasonable estimate of annual savings.
2. Proactive alerts instead of reacting after the fact
Part of the value arrives before an incident ever becomes one for the customer. Instead of waiting for a user complaint or a hard threshold to trip, an observability platform notices anomalous behaviour, an unusual traffic pattern, or a service slowly degrading and flags the team while the problem is still contained. That keeps more incidents from ever reaching the customer and, with them, the direct losses and SLA penalties they'd otherwise trigger.
3. Fewer repeat incidents
Here, the metric is how many times the same root cause shows up per quarter. Correlated telemetry can reveal that one dependency has caused the same cascading failure three or four times. That turns a one-off fix into a permanent one. The savings shift from "faster per incident" to "fewer incidents overall". That's usually the bigger number over a year.
4. Tool consolidation and less time spent maintaining monitoring itself
Every separate monitoring tool is its own license, its own integration, and its own chunk of engineering time to maintain. Merging fragmented systems into a single observability layer doesn't just remove duplicate license spend. It directly cuts the time a team spends maintaining the observation system itself: updates, configuring new alerts, syncing data between tools. This rarely makes it into the first-pass ROI calculation, even though it's often one of the most predictable savings lines.
5. Planning capacity on data, not guesswork
The metric here is infrastructure spend per unit of actual load, not per worst-case 'just in case' scenario. This is where observability and DevOps practices intersect directly: real usage patterns, real seasonal peaks, and real per-service limits replace two expensive habits: over-provisioning "just in case" and reactive, premium-priced emergency scaling. That shows up directly in the infrastructure spend line
Observability savings show up on a CIO's dashboard
Every point above connects to a KPI already on a CIO or VP Engineering dashboard: MTTR, SLA attainment, the ratio of planned to unplanned work, infrastructure cost per transaction.
Put simply: faster root-cause resolution, fewer incidents, lower cloud spend, and savings from tool consolidation together mean the company keeps more money than it spent on the observability system itself. That's the case for the investment.
Why planning comes before the payoff
None of this happens overnight, and overselling the timeline quickly costs credibility with technical buyers. An observability solution isn't off-the-shelf software that switches on and immediately delivers maximum results. To get the best price-to-value ratio, a business needs deliberate planning from the start: what coverage does the system actually need, which tools should be consolidated first, where will the AI component deliver the biggest effect, and where would it just be an unnecessary cost. Investing without that planning often captures only part of the possible savings — the platform gets bought, and the volume of avoided losses turns out to be far smaller than it could have been.
This is where ELEKS delivers value that a platform license alone doesn't provide — and it doesn't stop at go-live. Our team supports a client through the entire journey: from gathering information and analysing the current state of the client's systems to identify real needs and priorities, through planning coverage and consolidating existing tools, to implementing the observability solution itself.
But the platform is only as good as the work done with the data it produces. Dashboards and traces don't reduce costs by themselves — someone has to read the signal correctly, decide what it means for the architecture, and act on it. That's the part clients most often lack in-house bandwidth for, and where ELEKS' ongoing support goes beyond keeping the lights on.
Our engineers use the observability data itself to do the intelligent work of continuously improving the client's services: tuning alert thresholds so teams stop reacting to noise, correlating recurring incidents back to specific architectural weaknesses, right-sizing compute and storage based on actual observed load rather than guesswork, and flagging where infrastructure spend is outpacing the value it delivers. Over time, this turns observability from a monitoring layer into an active driver of platform reliability and a lower total cost of ownership — the return keeps compounding well past the initial rollout.
That spares the client the need to go through a trial-and-error process alone, and gives confidence that the investment is directed, from day one — and every day after — where it delivers the greatest effect.
Get your custom fintech software
Explore the potential of AI
Boost the agility of your IT infrastructure