Infrastructure
October 13, 2026
By Adam Carnow
This audio is AI-generated. It may contain mispronunciations or unnatural phrasing.
The streets of Hoboken, New Jersey, play many roles. The same stretch of road that accommodates buses and bicycles could provide pedestrians with a car-free promenade on summer Sundays and serve as a critical defense against flooding during a storm.
To guide such transit decisions, city departments rely on maps made with geographic information system (GIS) technology. On GIS maps, they can layer data to analyze safety risks, coordinate construction projects, and identify opportunities to simultaneously improve mobility and climate resilience.
The approach has helped the city go nine years without a traffic fatality while advancing several climate adaptation and development projects.
A Small City with Big Challenges
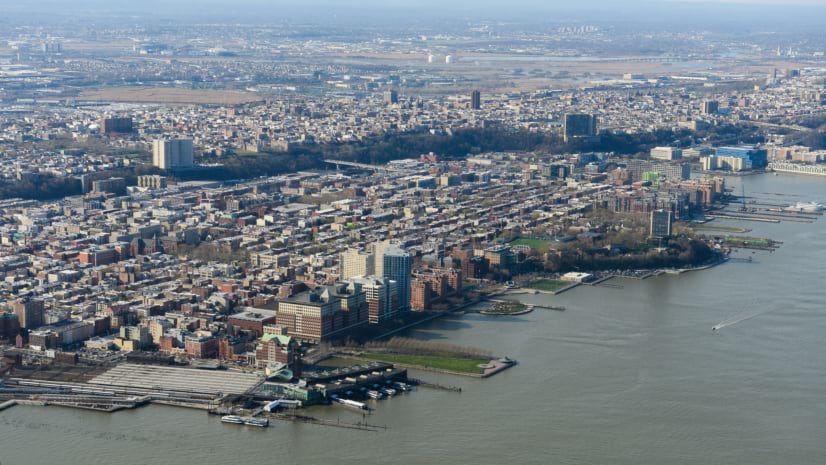
Hoboken occupies just 1.2 square miles. Within that space, city leaders must balance transportation safety, flood resilience, redevelopment, public space improvements, and infrastructure modernization. Residents, businesses, and critical infrastructure face ongoing risks from stormwater and coastal flooding—as about 80 percent of land sits within a floodplain. At the same time, the city is working to accommodate growth and advance its Vision Zero commitment to eliminating traffic deaths and injuries.
“We have a very small staff, but a very ambitious portfolio,” said Gregory Francese, Hoboken’s deputy director of transportation planning, policy, and capital projects. “It’s essential that we are working cross-departmentally.”
Collaboration becomes essential when priorities converge. Transportation planners must work alongside engineers, parks staff, redevelopment officials, and resilience specialists to redesign streets, build public spaces, and upgrade aging infrastructure. A roadway project may include bike facilities and safer pedestrian crossings, while a flood mitigation project might create new parks, improve stormwater storage, and reshape nearby intersections with curb extensions that include bicycle parking and green infrastructure.
A collaborative approach became especially important after Hurricane Sandy inundated the city in 2012. Since then, the city has invested heavily in flood mitigation infrastructure, including a network of resiliency parks, roadway improvements, and stormwater management projects. These projects pursue multiple goals: improving safety, mobility, public space, and climate resilience.
Seeing the City as One System
The city’s enterprise GIS facilitates collaboration, allowing staff to maintain and share data across departments. Teams can build on one another’s work rather than starting from scratch. When planners evaluate a potential traffic safety or stormwater improvement, they can combine transportation and rainfall data with park locations, redevelopment plans, or utility infrastructure to better understand how a project fits into the larger picture.
“When we create new datasets, we usually just upload them, and then other departments can use that information to provide a richer level of analysis,” Francese said.
One of the most important datasets supports Hoboken’s Vision Zero initiative. City staff used GIS to map locations where serious traffic injuries have occurred, allowing them to visualize a citywide high-injury network. By combining crash data with information about schools, redevelopment areas, and planned capital projects, the city can prioritize improvements where they are likely to have the greatest impact.
The analysis extends beyond traffic safety. Hoboken’s transportation team has also created a digital inventory of the city’s curb space, mapping loading zones, hydrants, driveways, bus stops, and parking regulations. The information helps staff evaluate requests for new loading zones, supports roadway redesign projects, and improves understanding of how public space is being used.
Francese said GIS has become so embedded in daily operations that city staff rarely think about it as a specialized technology. They work with geospatial data and conduct analyses themselves, rather than relying on dedicated GIS analysts.
“We don’t always acknowledge it ourselves because it has become such second nature,” he said.
Managing a Citywide Transformation
Across the Northeast, Hurricane Sandy caused more than $70 billion in damage and prompted communities to rethink how they prepared for future climate risks.
The US Department of Housing and Urban Development launched Rebuild by Design, a nationwide competition that pairs communities with architects, engineers, planners, and designers to develop innovative resilience strategies. The initiative ultimately awarded federal funding to seven projects.
In New Jersey, one of those investments became the Hudson River project, a regional flood protection effort spanning Hoboken and nearby Jersey City and Weehawken. The project initially received $230 million and has since expanded to include floodwalls, parks, pumping infrastructure, and other improvements designed to reduce the impacts of future storms. Construction affects multiple jurisdictions, county roads, transit routes, and several of Hoboken’s major gateways.
For Francese, GIS plays an important role in helping stakeholders understand project complexities. The city uses traffic and construction data to monitor conditions, evaluate detour routes, and identify potential congestion hot spots as work progresses. Viewing closures, construction, and traffic together on one map helps staff anticipate how one project may affect another and ripple across mobility citywide.
“It’s helpful to be able to see it all in one place,” Francese said.
The same approach guides projects at the neighborhood level. Hoboken’s network of resiliency parks collects and stores stormwater during major rain events while also creating recreational space, supporting redevelopment, and drawing more pedestrians and cyclists.
Northwest Resiliency Park combines recreation space with underground stormwater storage. During planning and design, transportation planning and engineering staff worked collaboratively with the park’s design team to evaluate surrounding streets and intersections to ensure that residents could safely access the park on foot or by bicycle. The analysis informed improvements around the project area and helped integrate Vision Zero goals into a broader investment.
Beyond parks, roadway reconstruction projects include upgrading underground infrastructure, adding bicycle facilities, improving crosswalks, and supporting redevelopment plans for growing mixed-use neighborhoods. Rather than pursuing those goals independently, city departments use the same geographic information to understand how investments in one area can advance multiple priorities at once.
“These resiliency projects are an opportunity for us to add Complete Streets and Vision Zero components through those projects,” Francese said.
A Vision for the Future
Hoboken’s work is far from finished. The city is continuing to redesign its waterfront, expand its Green Circuit, complete construction on Rebuild by Design, and advance its Vision Zero goal of eliminating all traffic deaths and injuries by 2030.
To support these efforts, city staff are expanding how they use data. Hoboken is developing public-facing GIS dashboards that track safety improvements, intersection upgrades, and progress toward mobility goals. The city also continues to collect and share feedback, helping residents shape projects and identifying issues that may not appear in crash reports or engineering studies.
For Francese, that combination of shared data and public engagement helps ensure that infrastructure investments reflect both objective conditions and community needs.
“We asked people where they feel less safe, and we’re able to overlay that information with actual crash data to see if there’s overlap. It’s also an opportunity to learn new things about where we need to focus safety improvements in the future,” he said.
As Hoboken continues to evolve, GIS remains a common thread connecting departments to city priorities. The technology helps staff see how transportation, redevelopment, public space, and resilience efforts influence one another, making it easier to invest in projects that deliver multiple benefits. For a city balancing ambitious climate goals with day-to-day operational demands, that shared understanding has become just as important as any individual project.
Learn more about how urban and community planners use GIS to analyze community needs; strategically design development; and support resilient, sustainable growth.
Adam Carnow is the Public Works Industry Marketing Specialist at Esri, the global market leader in Geographic Information Systems (GIS). He is a keynote speaker and thought leader. He collaborates with his colleagues, Esri Partners, and customers to lead the successful application of ArcGIS across the public works disciplines. Mr. Carnow has over 30 years of experience as a GIS practitioner in the public and private sectors, as well as academia. During his 15-year career at Esri he has previously served as a Local Government Account Manager and a Community Evangelist. Prior to joining Esri, he practiced as a GIS consultant and planner in the AEC industry. He has taught undergraduate and graduate GIS courses at the University of South Florida. He holds a BA in Geography, and a MA in Urban and Regional Planning from the University of Florida and has achieved certification as an Urban Planner (AICP) and GIS Professional (GISP). He is a member of the Urban and Regional Information Systems Association (URISA) Board of Directors and a graduate of the URISA GIS Leadership Academy.