ClickHouse Cloud runs on many thousands of Kubernetes nodes across AWS, GCP, and Azure. At that scale, a node with a broken disk, a stuck kernel task, or a half-working network is a daily event. Most of these failures do not look like a node failure at first. Kubernetes still reports the node as Ready. The cloud provider console shows the instance as running. What you see instead is a ClickHouse replica that cannot write to its cache disk, a pod that stays in ContainerCreating, or a query that times out on one replica and works on the others.
While cloud service providers (CSPs) sometimes try to detect and fix these issues, they are not succeeding at these in 100% of cases. Also, the “fix” behavior differs between cloud providers and is not always the optimal solution for a given issue. We wanted to have more control and consistency across CSPs. Hence, we started a project we called Compute Layer Reliability.
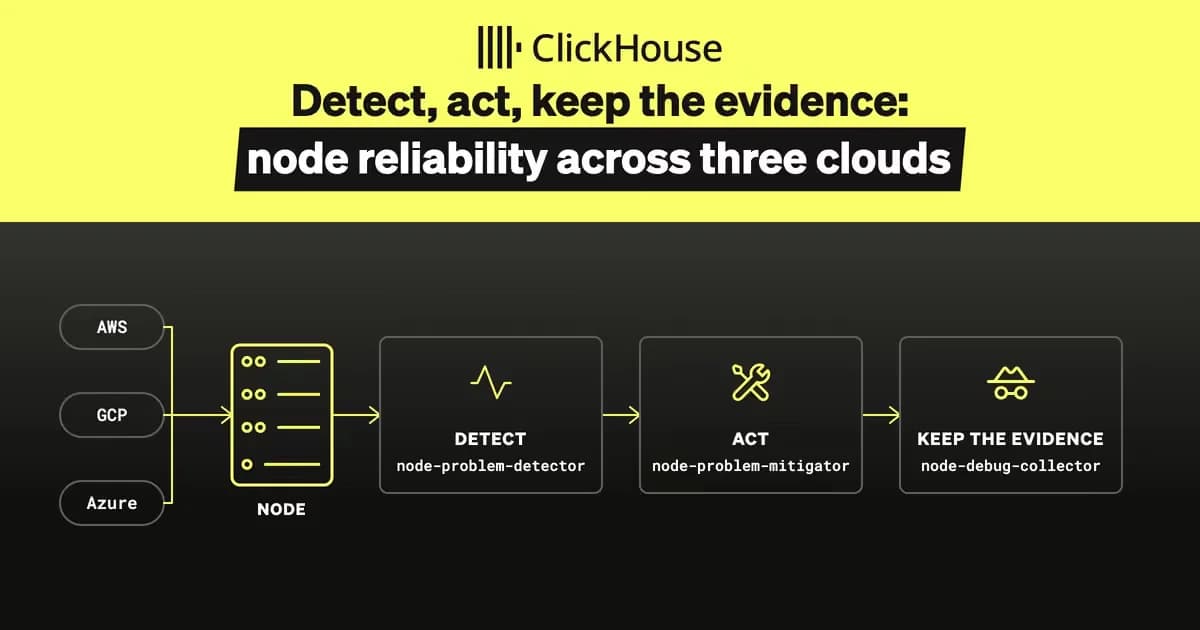
This post explains what we found when we looked at how node health was handled on each cloud, why we decided to own both detection and reaction ourselves, and the three components we built or adopted to implement it:
- Node Problem Detector (NPD), the sensor. Cloud-native component adopted for our needs. It runs on every node and turns kernel and system log lines, plus a few active probes, into Kubernetes node Conditions and Events.
Node Problem Detector (NPD), the sensor. Cloud-native component adopted for our needs. It runs on every node and turns kernel and system log lines, plus a few active probes, into Kubernetes node Conditions and Events.
- Node Problem Mitigator (NPM), the actuator. It is a controller that watches those conditions and removes the node from service in a controlled way: taint, drain, and then terminate the instance.
Node Problem Mitigator (NPM), the actuator. It is a controller that watches those conditions and removes the node from service in a controlled way: taint, drain, and then terminate the instance.
- Node Debug Collector (NDC), the forensics tool. It captures logs and system state from a node before the node is gone, even when the node is no longer reachable.
Node Debug Collector (NDC), the forensics tool. It captures logs and system state from a node before the node is gone, even when the node is no longer reachable.
We found an EC2 node where one of the two NVMe drives behind a software RAID array had failed. The kernel had logged raid0 array has a missing/failed member, followed by a stream of EXT4 errors and I/O errors on the cache filesystem. The ClickHouse pods on that node had been failing writes for a prolonged time. No data was lost, but the system was degraded and the on-call operator spent a lot of time trying to figure out the root cause.
Nobody was paged about the node being unhealthy itself. The Kubernetes Node object stayed in Ready status. The cloud provider had not flagged the instance. The only place the failure was visible was the kernel ring buffer on the VM itself.
We did have Node Problem Detector running on that cluster. NPD is the standard Kubernetes tool for this job: a DaemonSet that tails kernel and system logs, matches them against rules, and reports problems on the Node object. When we checked its logs, it had matched the EXT4 errors. But the upstream rule for EXT4 errors is marked “temporary.” A temporary rule produces a Kubernetes Event, which expires after an hour. It does not set a Node condition, and nothing in our stack reacted to it.
And there were other cases where just draining nodes resolved various issues. Each time, a human found the issue by reading logs, and each time the fix was the same.
Kubernetes has built-in Node conditions: Ready, MemoryPressure, DiskPressure, PIDPressure, and NetworkUnavailable. The kubelet sets them, and Kubernetes built-in controllers react to them. When Ready goes false, the node gets a taint, and pods are evicted from it.
These conditions cover the kubelet's own view of the node. They do not cover a degraded RAID array, a filesystem that has gone read-only, a container runtime stuck on a hung kernel task, and many other failure modes where the kubelet keeps reporting Ready while the VM is degraded.
Kubernetes v1.37 comes with support for Lifecycle Conditions, which partly improves the monitoring of node states and control of the drain process. This wasn’t available when we started the project and still is not quite mature enough to be used in production environments.
We ran a fleet on three clouds, and each one had a different answer. We did extensive research on each cloud and pulled the actual running configuration from built-in VM agents that are shipped by some cloud providers. This is what we found.
On AWS, we had node auto-repair disabled on purpose because we saw cases where a disk fragmentation heuristic kept marking nodes unhealthy. The auto-repair behavior also affects how the volumes are mounted and unmounted to the node. Simply evicting pods from unhealthy nodes is faster than waiting for auto-repair to finish. In most cases, the auto-repair is a reboot of the node in place, meaning running containers are going down for a short period of time. Rebooted nodes often had the same issue again.
On GCP, the provider deploys its own NPD on every node with a long list of checks, including several custom plugins. Auto-repair was disabled for similar reasons. Built-in NPD checks didn’t cover important signals we cared about.
On Azure, the provider also runs NPD as a host process, again with many checks. Azure has no built-in mechanism to act on NPD-published conditions. There is no way to control the auto-repair mechanism for these VMs. In case of issues detected by Azure, a VM can be rebooted, reimaged, or redeployed. This means it still can bring previous issues back after the process finishes, and it still does not cover signals we cared about.
We decided to choose our own path: implement consistent detection, reaction, and debugging info collection across all 3 cloud providers.
- Own detection. We run our own node-problem-detector NPD configuration on all three clouds. We write the checks ourselves, based on the failures we had actually seen. The failures that hurt us become permanent conditions, not events that expire after an hour.
- Own reaction. We do not try to repair a node in place. A node that reports a hardware or kernel problem is taken out of service, rescheduling workloads on healthy nodes. We wrote a controller, node-problem-mitigator (NPM), that watches the conditions published by NPD and applies one configured response per condition, from observe-only up to terminating the instance.
- Keep the evidence. Before the project, collecting diagnostics from an unhealthy node was a manual race against the drain, and often the node no longer answered. Operators had to remember different steps for different CSPs and execute the same sequence of commands to upload collected data into the shared storage for analysis. We have created node-debug-collector to address these issues.
Kubernetes cannot see inside the node
As we saw above, some node failures never reach Kubernetes. A kernel soft lockup or an NVMe cache disk that failed to mount leaves the node Ready while impacting the workload. We needed a sensor inside the node that turns those failures into signals Kubernetes understands. We chose the upstream Node Problem Detector (NPD) over writing our own agent. It is a small DaemonSet, it is actively maintained, and it emits standard Node Conditions and Events. We deploy the upstream image unchanged. Everything we add is configuration, so all our clusters across three clouds run the same detector with one catalog of checks, and adding or tuning a check is a configuration change and a rollout.
Monitoring from the inside
NPD ships several monitor types. We use two of them.
Log monitors: NPD tails the kernel ring buffer or a journald unit and matches every line against regex rules. They are cheap and cover anything that leaves a trace in logs. This is the rule that catches errors on an ext4 filesystem:
The main drawback of log monitors is their stickiness: after matching a log pattern, the resulting Node Condition remains active indefinitely. Custom plugin monitors run checks repeatedly and update the condition based on the latest result.
Custom plugin monitors: run a script on a schedule and read its exit code and stdout. We use them when there is nothing in the logs or when one log line is not enough. One example is the NVMe timeout check, which fires only when at least two devices time out within the same minute, because a single device timing out is usually a self-healing blip and two almost always mean a fault on the host side. Another example is a script that checks that the local NVMe disks are properly mounted.
Regardless of the detection method, every issue detected in our setup becomes a Condition published on the Node object. This gives us visibility into node issues and allows us to act on them.
Fewer false positives beat faster detection
A good part of the work went into investigating node problems in production, turning each one into a detection, and then tuning it to avoid false positives. Moving customer workloads is expensive and can cause some disruption, so each check needs to show that the node itself has a problem, rather than just one pod or a brief glitch. We also want to avoid acting on cluster-wide problems, like a bad network policy or a CNI misconfiguration, since moving workloads won’t fix those and will likely make the impact worse.
The NVMe timeout check described above counts impacted devices for that reason. The network check is a good monitoring signal, but we do not mitigate it: a region-wide outage makes every node fail the same probes, and moving pods would not help. The pod creation check ignores the first minutes after boot, when failures are normal while the node CSI/CNI is still initializing. Unexpected cases are investigated and handled by normal on-call procedure.
The same set of checks is deployed on every cloud. GCP and AKS deploy their own NPD daemons, and it is not possible to disable them. Where a provider's managed NPD already reports a condition, we turn ours off instead of reporting the same problem twice.
Fig: Problems detected in production nodes over one week
The mitigation problem
With big power comes big responsibility, which means no existing tool wants to take responsibility for killing the wrong node. And they are, therefore, often toothless for our purpose: when we are sure that the node is bad, we need it gone. With that in mind, the termination task becomes quite resistant to being “industry-standardized”: there is no one-size-fits-all solution. The issue is not that the existing tools aren’t sophisticated enough, but the “termination threshold” can be quite different depending on the following:
- Type of workloads (stateful/stateless)
- Maturity of the software running in the cluster (PDBs, SIGTERM discipline, timeout guarantees, etc.)
- Developer culture in the organization / YOLO level of the cluster operators
We looked at existing open-source controllers before deciding the course of action:
- Medik8s node-healthcheck-operator and self-node-remediation. Capable, but requires CustomResources to be installed and configured. The chain from a kernel log line to a drained node passed through NPD, a condition, an operator, a custom resource, and a second DaemonSet. Too many moving parts for what we needed, while not allowing us to easily implement custom logic if we need it.
- Draino. Abandoned, last commit around six years ago. Only drains.
- Cluster API MachineHealthChecks. A much larger architectural change than the problem justified.
- The new upstream node-readiness-controller combined with descheduler. Zero custom code, and it reuses a component we already run. But the coupling is loose: if the descheduler is misconfigured, nodes get tainted and never drained. It also gave us no control over the later steps, such as terminating the instance. Also, Node Readiness Controller itself was immature when we started the project.
- Karpenter's own node auto-repair. We don’t run Karpenter in our GCP and Azure clusters. The feature itself depends on AWS node agent, not allowing cross-cloud consistency.
Our own NPM
So we built our own controller with a simple mission: to kill the bad nodes with the desired level of aggressiveness. The controller only destroys/removes the nodes and never determines whether the node is good/bad; this task is delegated to node-problem-detector.
The controller watches the nodes’ status and conditions, and each condition is configured with the steps to mitigate the node (least aggressive to most):
- Evaluate: dry run to monitor the situation
- Drain: gracefully remove the pods while honoring the PDBs
- Terminate: drain (with timeout), then terminate the instance/VM.
The steps can be changed for an ongoing mitigation (if another condition with more aggressive steps fires), but the direction is only one way: toward more aggressive steps. Regardless of the chosen steps, node debug information can be collected first with a pre-mitigation Job (see next section on NDC). Debug bundle collection is best-effort by default; it does not block mitigations to ensure we get rid of unhealthy nodes as soon as possible.
Safety When you deploy something like this into a production cluster, the first thing that comes to mind is “What if?” What if it starts deleting too many nodes at once? What if there are workloads that we prefer humans to verify before killing? Node-problem-mitigator uses various safety gates to mitigate the mitigation risk:
- Kill switch: config map value that stops any controller activity
- Dry-run/evaluation mode: preview would-be mitigations without actually performing them
- Exclusions: workloads’ namespaces, node taints, annotations, and labels; we can filter and skip these nodes
- Global node mitigation cooldown: how fast nodes can be mitigated. For example, it can be configured to a maximum of one node mitigation per 15 min (per cluster).
- Expose various metrics and alert on stuck mitigations, an unusually high number of mitigations, etc.
Rollout
Rolling out such a “dangerous” tool is a big responsibility. Fortunately, our team was brave enough to take it, one step at a time:
- Start with evaluating the conditions and their patterns. Generously cover the process with sensors and alerts; monitor the dashboard manually at first.
- Gradually configure more aggressive mitigations for the conditions we’re confident about.
- Start with dev and staging environments, and keep it one step ahead of production.
- Keep configurations granular; some conditions are riskier than others.
Node-problem-mitigator is open-source, and contributions are welcome:
When we detect a suspicious node, the first thing we would like to do is to get some telemetry out of it: logs, metrics, system status, etc. When a node is deleted, we lose potentially useful diagnostics. Wouldn’t it be nice to have a debug bundle of the bad node right before we replace it?
Different cloud service providers have different methods of debug bundle collection (EC2RL, AKS periscope), but they are cloud-specific and mostly tailored for their support. Debug collections become a hassle: different authorization and collection methods for different clouds, and matching nodes with their cloud instance representation. That’s quite a lot of work, especially during the incident.
Out of three CSPs that we support, GCP is using the closest tool that matches our requirements: sosreport. It’s highly modular, open source, and cloud-agnostic. Actually, the number of plugins it has is huge, and we had to sift through all supported collectors and distill the package to only contain collectors relevant to our clusters.
Great, we have our collector. Now the only thing that is left is to deliver it to a bad node, run it, and collect the results. It turned out that it’s actually a much harder part of the debug collection: between the fact that we are using 3 different cloud providers and the fact that the node is bad, delivery and execution can be a challenge. The bad node might be so bad that it is not properly emitting/responding to telemetry collections, or might be completely unresponsive.
Our take on this problem:
- Try to use kubectl cp and kubectl run.
- If the kubelet is dead, fall back to SSM/S3 as transport (and their equivalents in GCP/Azure).
- Optionally, run in snapshot mode: collect the debug offline. Clone the root volume through a snapshot, create a temporary instance/VM, attach the root volume, and collect anything that is available offline.
Snapshot mode can also be used for “fragile” nodes: the ones where we have concerns about the minimal impact collectors themselves introduce.
The tool can be used by developers, as well as auto-triggered by node-problem-mitigator. In both cases, the CSP specifics are safely abstracted away so the collection can be performed by a single command, and cloud specifics will be inferred from node attributes like ProviderID. No sensitive data is dumped from the node, to respect our data privacy policies.
Since the rollout of the NPD++NDC system, we are remediating a number of unhealthy nodes every month. The improved visibility into these issues allows us to find new failure modes and also validate changes in VM configurations before they are deployed to production. We get diagnostics collected automatically and can provide them to CSP support without delays.
As with any other “reliability improvement,” it has costs: increased complexity of the system. New automations introduce new failure modes, and we were focusing hard on ensuring that we understood and prepared for these new challenges. A detection rule that is too broad can drain healthy nodes without fixing the issue; a mitigator bug can drain too many nodes at once or, vice versa, suppress the error without acting. We accepted that trade-off because the safety gates (kill switch, dry-run, rate limit, and exclusions) turn each of these failure modes into a bounded and observable event, and because a controller that runs the same way on three clouds is easier to reason about than three provider-specific repair mechanisms which we cannot fully control.
It is worth noting that this system does not react to external signals about VM issues. AWS publishes Status Checks for EC2 instances, GCP has integrity monitoring for shielded Nodes, and Azure . You also may want to act on nodes that appear completely unresponsive, to the point where NPD won’t publish any Conditions because it does not get a CPU or network resource share. We will cover handling of these situations in future posts.
Reach out if you want to join the team implementing projects like this at ClickHouse.