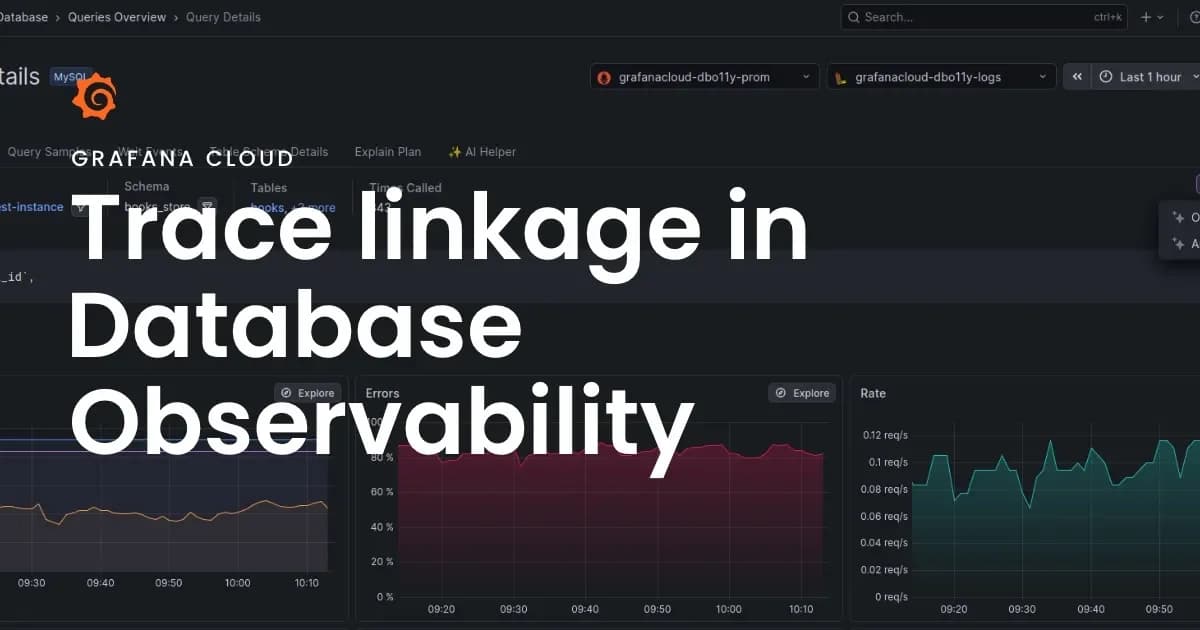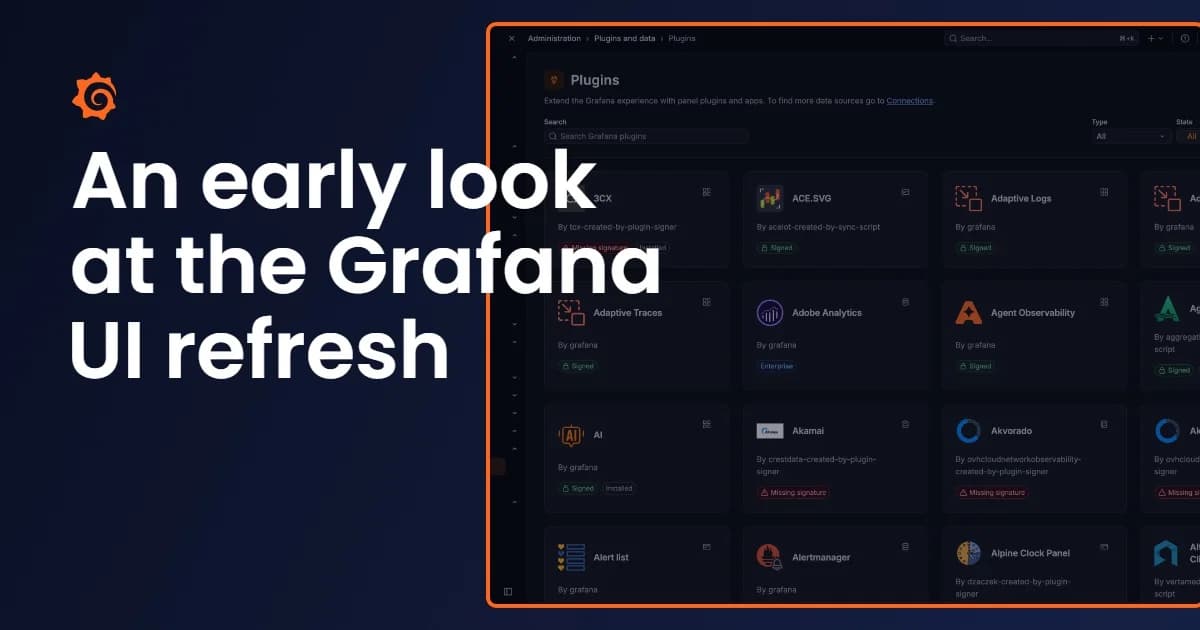
Whether you’re investigating an incident or just exploring your data, a clear, consistent UI helps you move between workflows and find what matters faster. As Grafana has grown to support more use cases, we’ve seen opportunities to improve on that experience. That’s why, as part of the Grafana 13.3 release, we introduced the first phase of our biggest visual refresh since Grafana 7.
We’re approaching this work in phases, with the refreshed UI currently in public preview in both Grafana Cloud and self-managed versions of Grafana, and your feedback will play a major role in shaping what comes next.
In this post, we’ll give you a closer look at why we decided to make this change now, why we think visual aesthetics matter in a UI, and the impact this will have on the Grafana user experience. You can also check out some of the visual updates in the video below.
Starting with why
“Purposes are deduced from behavior, not from rhetoric or stated goals.” – Donella Meadows
At Grafana Labs, our culture empowers individuals and teams to identify user needs, build solutions quickly, ship iteratively, and work in the open. This has allowed us to cover a large range of use cases with Grafana. But moving fast can come with challenges, including design debt, which leads to inconsistent and sometimes conflicting visual cues, workflows, and GUIs. We were aware of these challenges, but our focus remained steadfast on providing new functionality and supporting as many use cases as possible.
Meanwhile, over the last year, the product design team has worked with our engineers to build new interaction patterns to support AI solutions like Grafana Assistant and Assistant Workspace. Building these patterns opened the door to curiosity, and we started experimenting with new visual forms, colors, shapes, and effects that laid the groundwork for the refresh.
Through this work, our approach to UI style and aesthetics evolved, and so did our purpose: alongside supporting new workflows and use cases, we wanted to bring greater consistency to interactions and design patterns across Grafana. This refresh is the first step toward that goal.
Visual styling and usability
“The aesthetic quality of a product is integral to its usefulness.” – Dieter Rams
Earlier iterations of UI layering and visual grouping
So why invest in visual styling? To stay relevant? To facilitate sales conversations? Because it looks cool?
All of those reasons are valid, but at Grafana Labs, product designers are utilitarians first. We believe digital products should exist with a clear purpose and function in mind. We think each color, font style, and line should establish a clear information hierarchy and help users quickly understand what's on the page, ultimately making our product easier to use.
As more workflows shift to terminals and agentic chat interfaces, we believe investing in visual style now is foundational to Grafana’s future usability. When fewer user journeys rely on a traditional UI, those that do must emphasize clarity and consistency.
What’s new: a closer look
This first phase of the refresh focuses on making the Grafana UI clearer and more consistent across workflows and components, while giving you time to adapt to the changes. Here are some of the highlights:
- New default light and dark themes: These themes use completely new color palettes with improved accessibility compliance by design.
New default light and dark themes: These themes use completely new color palettes with improved accessibility compliance by design.
- Increased consistency across components: We have started to reduce the amount of available UI components and their variants. This means users only need to learn an interaction or a pattern once, and can then leverage it across the entire platform.
Increased consistency across components: We have started to reduce the amount of available UI components and their variants. This means users only need to learn an interaction or a pattern once, and can then leverage it across the entire platform.
- New font styles, borders, and shadows: By overhauling our visual primitives to work in a proportional and scalable way, we create layers of hierarchy and visual information. As part of our audits, we noticed that many areas of the UI competed for users’ attention. We’re moving to a state where you can immediately understand what’s most important on a page, so you can complete tasks faster and more efficiently. You’ll notice these changes across the building blocks of Grafana, including cards, panels, and drawers.
New font styles, borders, and shadows: By overhauling our visual primitives to work in a proportional and scalable way, we create layers of hierarchy and visual information. As part of our audits, we noticed that many areas of the UI competed for users’ attention. We’re moving to a state where you can immediately understand what’s most important on a page, so you can complete tasks faster and more efficiently. You’ll notice these changes across the building blocks of Grafana, including cards, panels, and drawers.
We’re rolling out the visual refresh gradually so Grafana contributors and users have time to adapt without disrupting critical workflows. Importantly, this is a visual refresh, not a redesign. Existing navigation stays the same, and there are no breaking changes for plugins.
To try out the new UI in self-managed Grafana, enable the grafana.visualDesignRefresh feature toggle. You can switch back to the previous styling at any time.
For a full list of changes in the public preview, please visit our documentation.
Curiosity, monitoring, and feedback
"There are three key practices needed in order to build and maintain a circle of competence: curiosity and a desire to learn, monitoring, and feedback." – Shane Parrish & Rhiannon Beaubien
Curiosity is a key attribute of product designers at Grafana Labs and we knew that unifying the look and feel across Grafana meant making choices that could elicit strong reactions. This is why learning, gathering feedback, and monitoring the response have been central to our process.
We could have spent a year working on what we think is a perfect new visual styling, running hundreds of internal iterations, but instead we started with early internal dogfooding of the refreshed UI. This led to honest discussions and opinions from Grafanistas across the company, helping us iterate the visual refresh rapidly into a version we could not have achieved without working openly.
Now, with the refresh in public preview, your feedback is central to how we’ll continue to refine our visual styling. Through our community Slack and a temporary in-app survey, you can tell us directly what’s working, what needs improvement, and what we might have missed. We monitor and discuss this feedback in the open, helping to amplify your voice and share it across the organization. Your responses will be integral to shaping future iterations of the refresh.
We can’t wait to hear what you think, and to continue our evolution toward a bolder visual experience for all Grafana users.